VS Code Lightrun plugin quick tour🔗
The majority of the work you do with Lightrun, such as troubleshooting, debugging, and performance testing, is performed directly from your integrated development environment (IDE) or the Lightrun CLI.
Using the Lightrun plugin, provided for a variety of popular IDEs (such as VSCode, IntelliJ, and PyCharm), you can insert Lightrun actions (Logs, Metrics, and Snapshots) anywhere within the source code of your running applications. Also, from within the Lightrun plugin for your IDE, you can view, in real time, the output of Lightrun actions.
The plugin includes the AI Debugger, powered by Generative AI, which automates runtime debugging directly into your IDE. It streamlines the troubleshooting process from ticket to fix, helping you quickly pinpoint application issues—even in mission-critical production workloads. For more information, see Lightrun Autonomous Debugger overview.
And, thanks to Lightrun's comprehensive range of integrations with third-party logging tools, from the plugin, you also can route output from Lightrun Logs and Metrics to your usual logging framework (such as New Relic and DataDog).
Scope of the quick tour🔗
This quick tour article provides an overview of the main features and functionalities of the Lightrun Plugin for Visual Studio Code (VSCode). For detailed information on procedures for running Lightrun actions and managing configurations within VSCode, see:
- Lightrun Dynamic Logs in VS Code
- Lightrun Dynamic Snapshots in VS Code
- Lightrun Metrics in VS Code
- Lightrun AI Debugger in VS Code
Prerequisites
These instructions assume that you have:
-
Installed the Lightrun VS Code plugin in your IDE.
-
Authenticated your Lightrun VS Code plugin with your organization's Lightrun account.
-
At least one agent associated with your app.
-
Opened the source code file for the running application from the IDE.
Lightrun plugin view🔗
Upon clicking, in the VSCode activity bar, the Lightrun plugin icon ![]() , the Lightrun sidebar opens. Follow the on-screen instructions to authenticate the plugin.
, the Lightrun sidebar opens. Follow the on-screen instructions to authenticate the plugin.
After authenticating your Lightrun plugin, your VSCode IDE should appear similar to the following image.
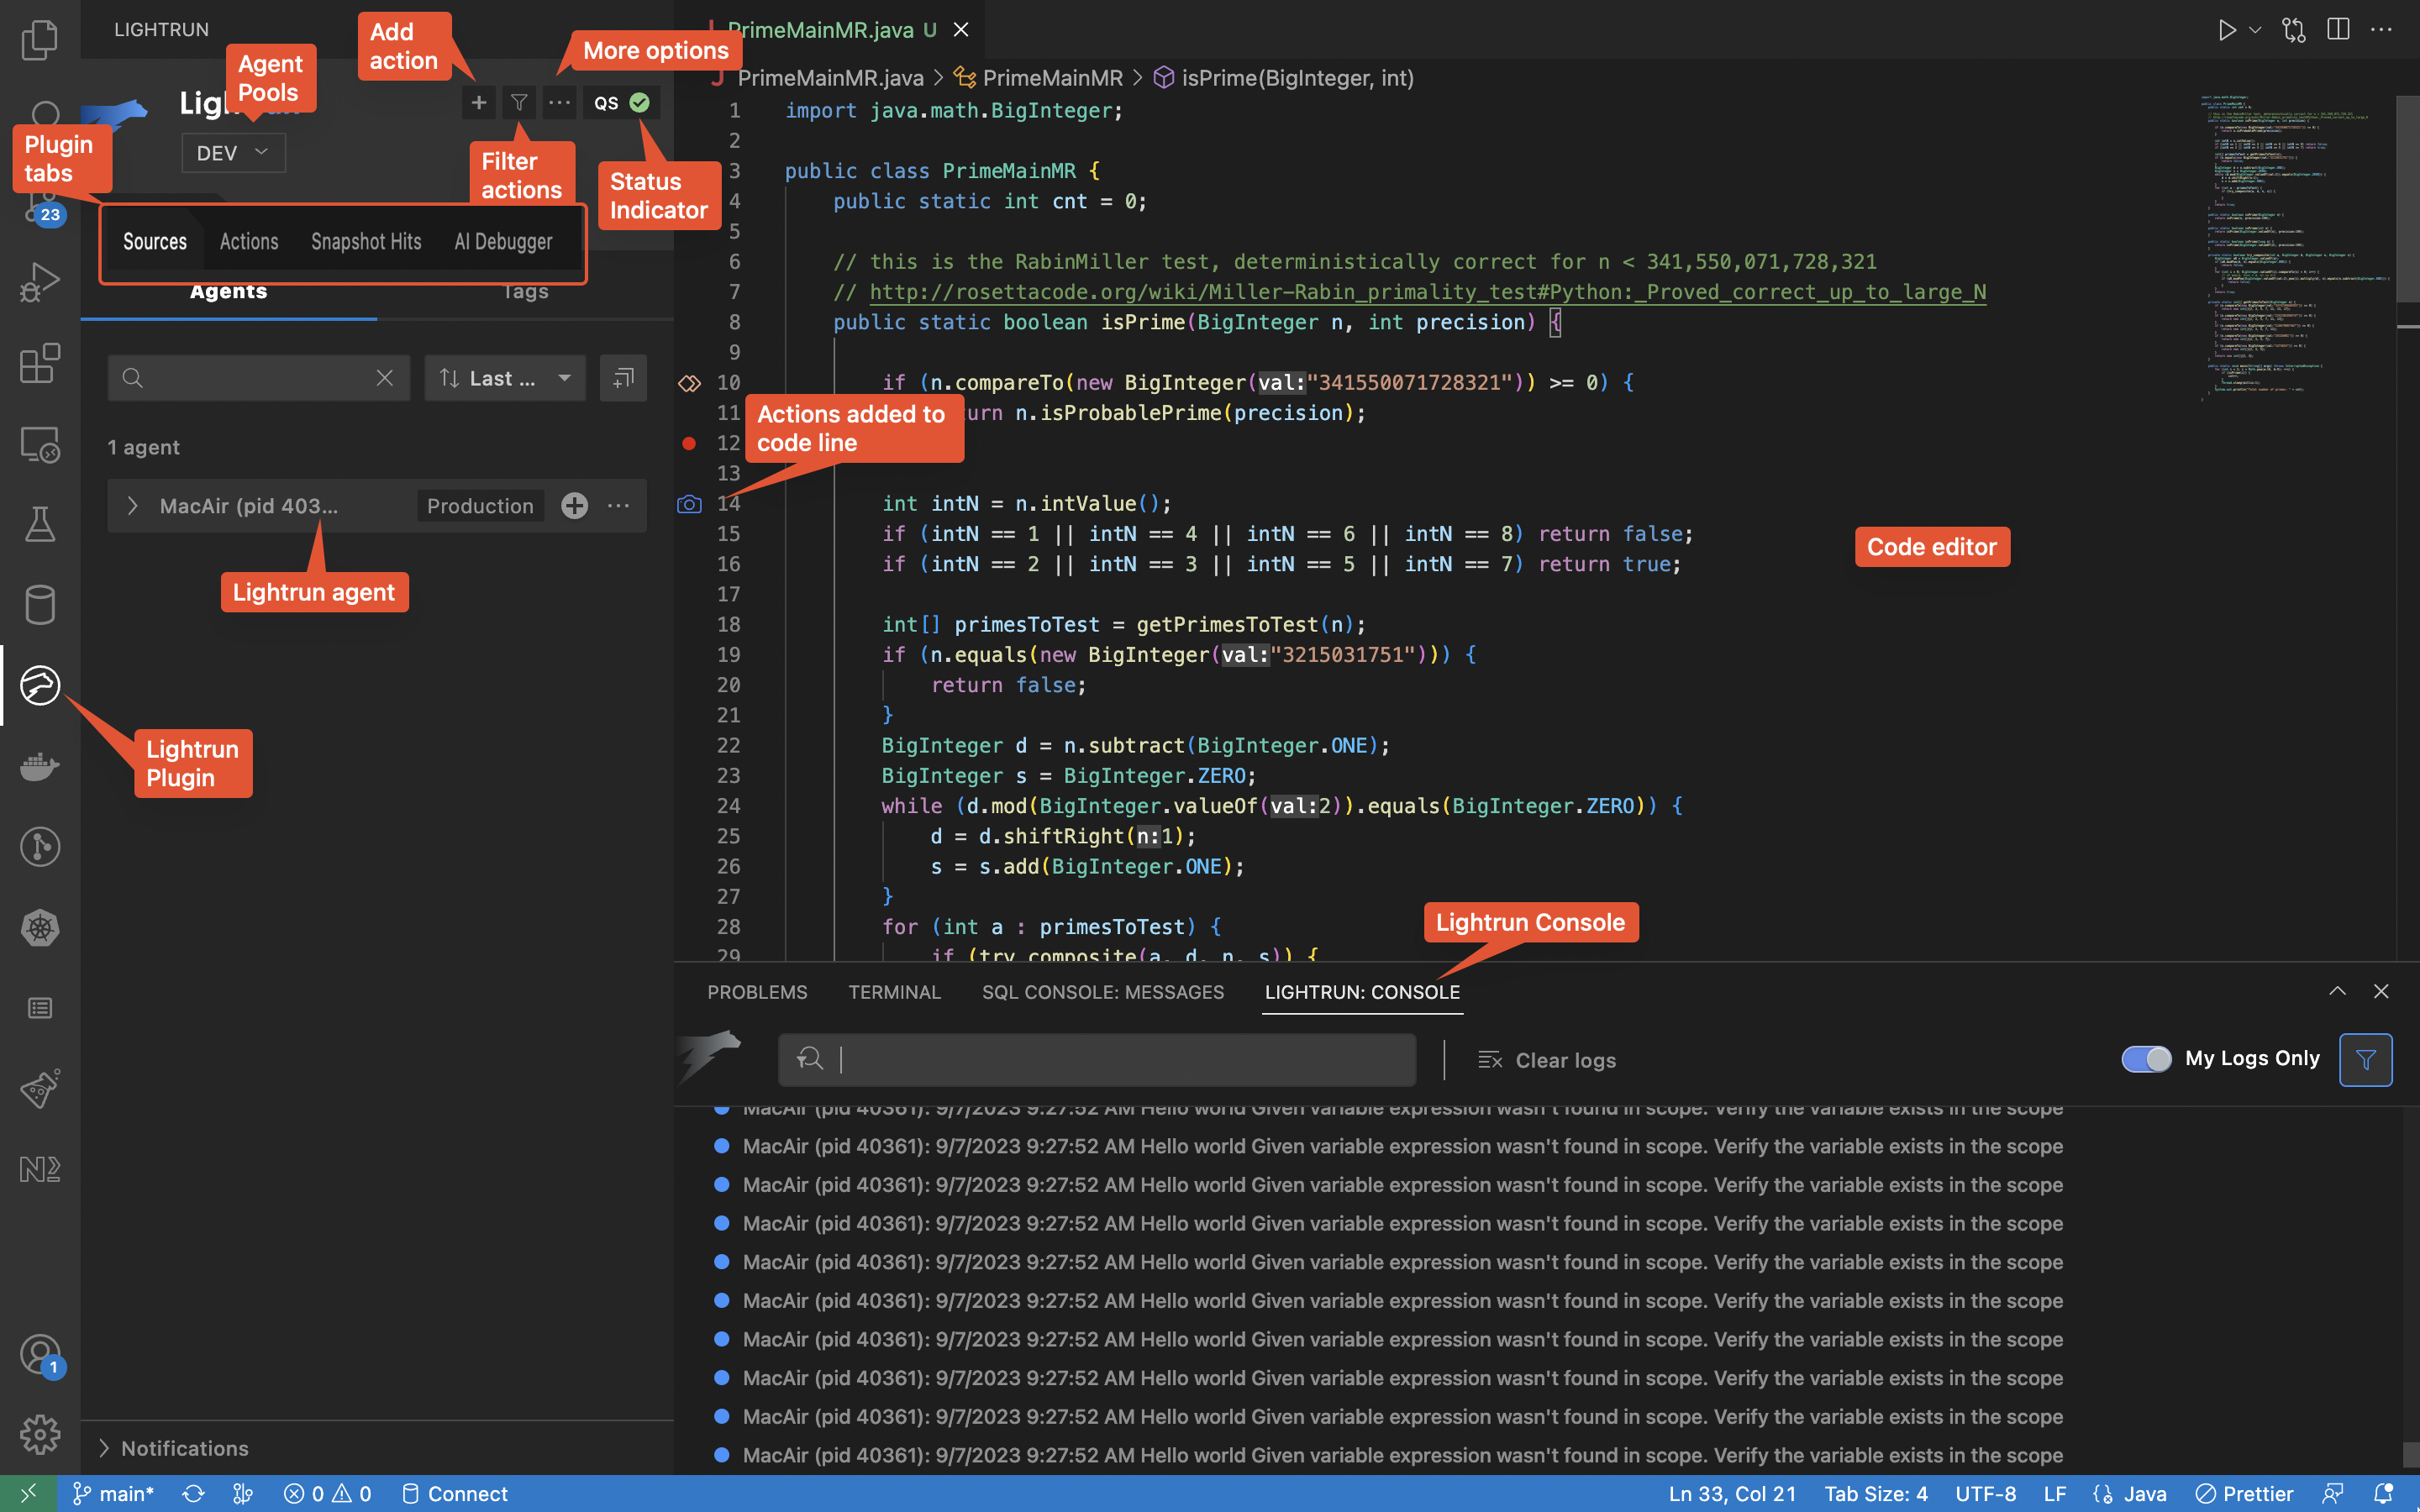
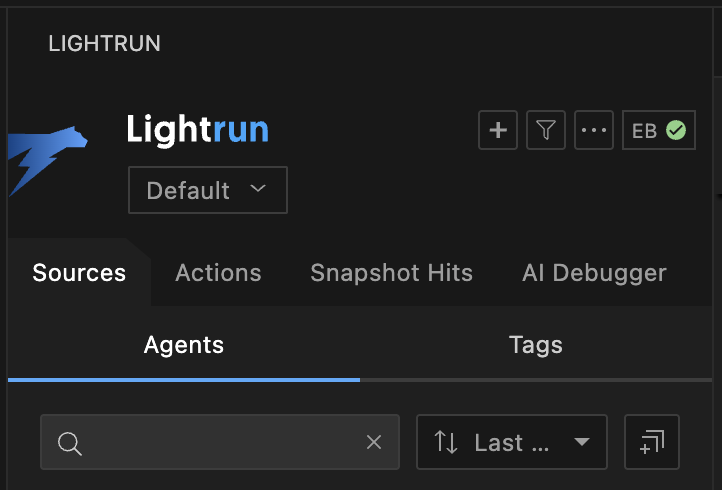
Top menu bar🔗
The top menu provides quick options to add actions, filter resources, and configure general plugin settings.
For customers with agent pools enabled, you can switch between predefined agent pools configured by your system administrator.
The top menu includes the following options:
- Deployment selector: Choose your current deployment.
- Filter: View all actions or your own.
- Add Action: Insert new Logs, snapshots or metrics.
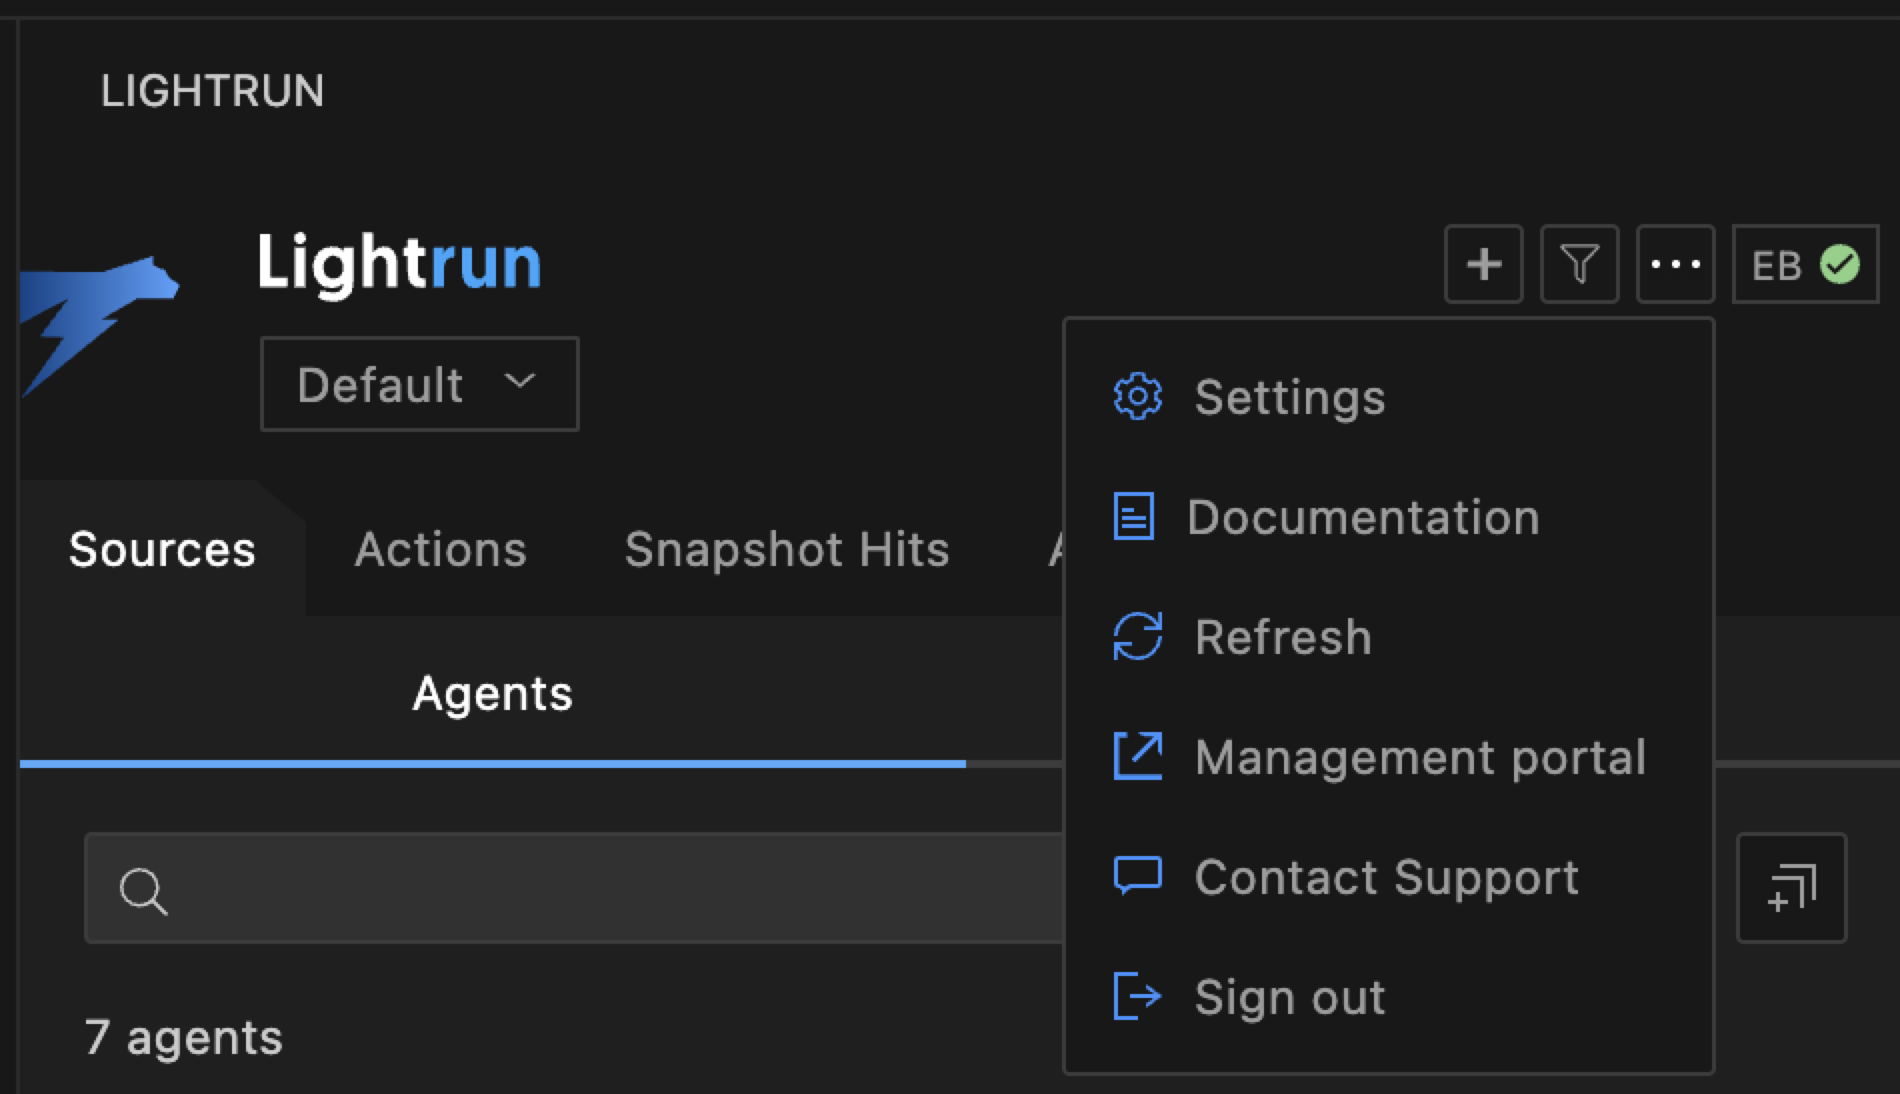
- More Options:
- Open plugin settings
- Access Lightrun documentation.
- Refresh the interface.
- Submit a Support ticket.
- Open the Lightrun Management Portal.
- Sign out of your account.
- User Indicator: Displays your initials.
Plugin settings🔗
-
Click the More Options option
 at the top of the plugin, and select Settings.
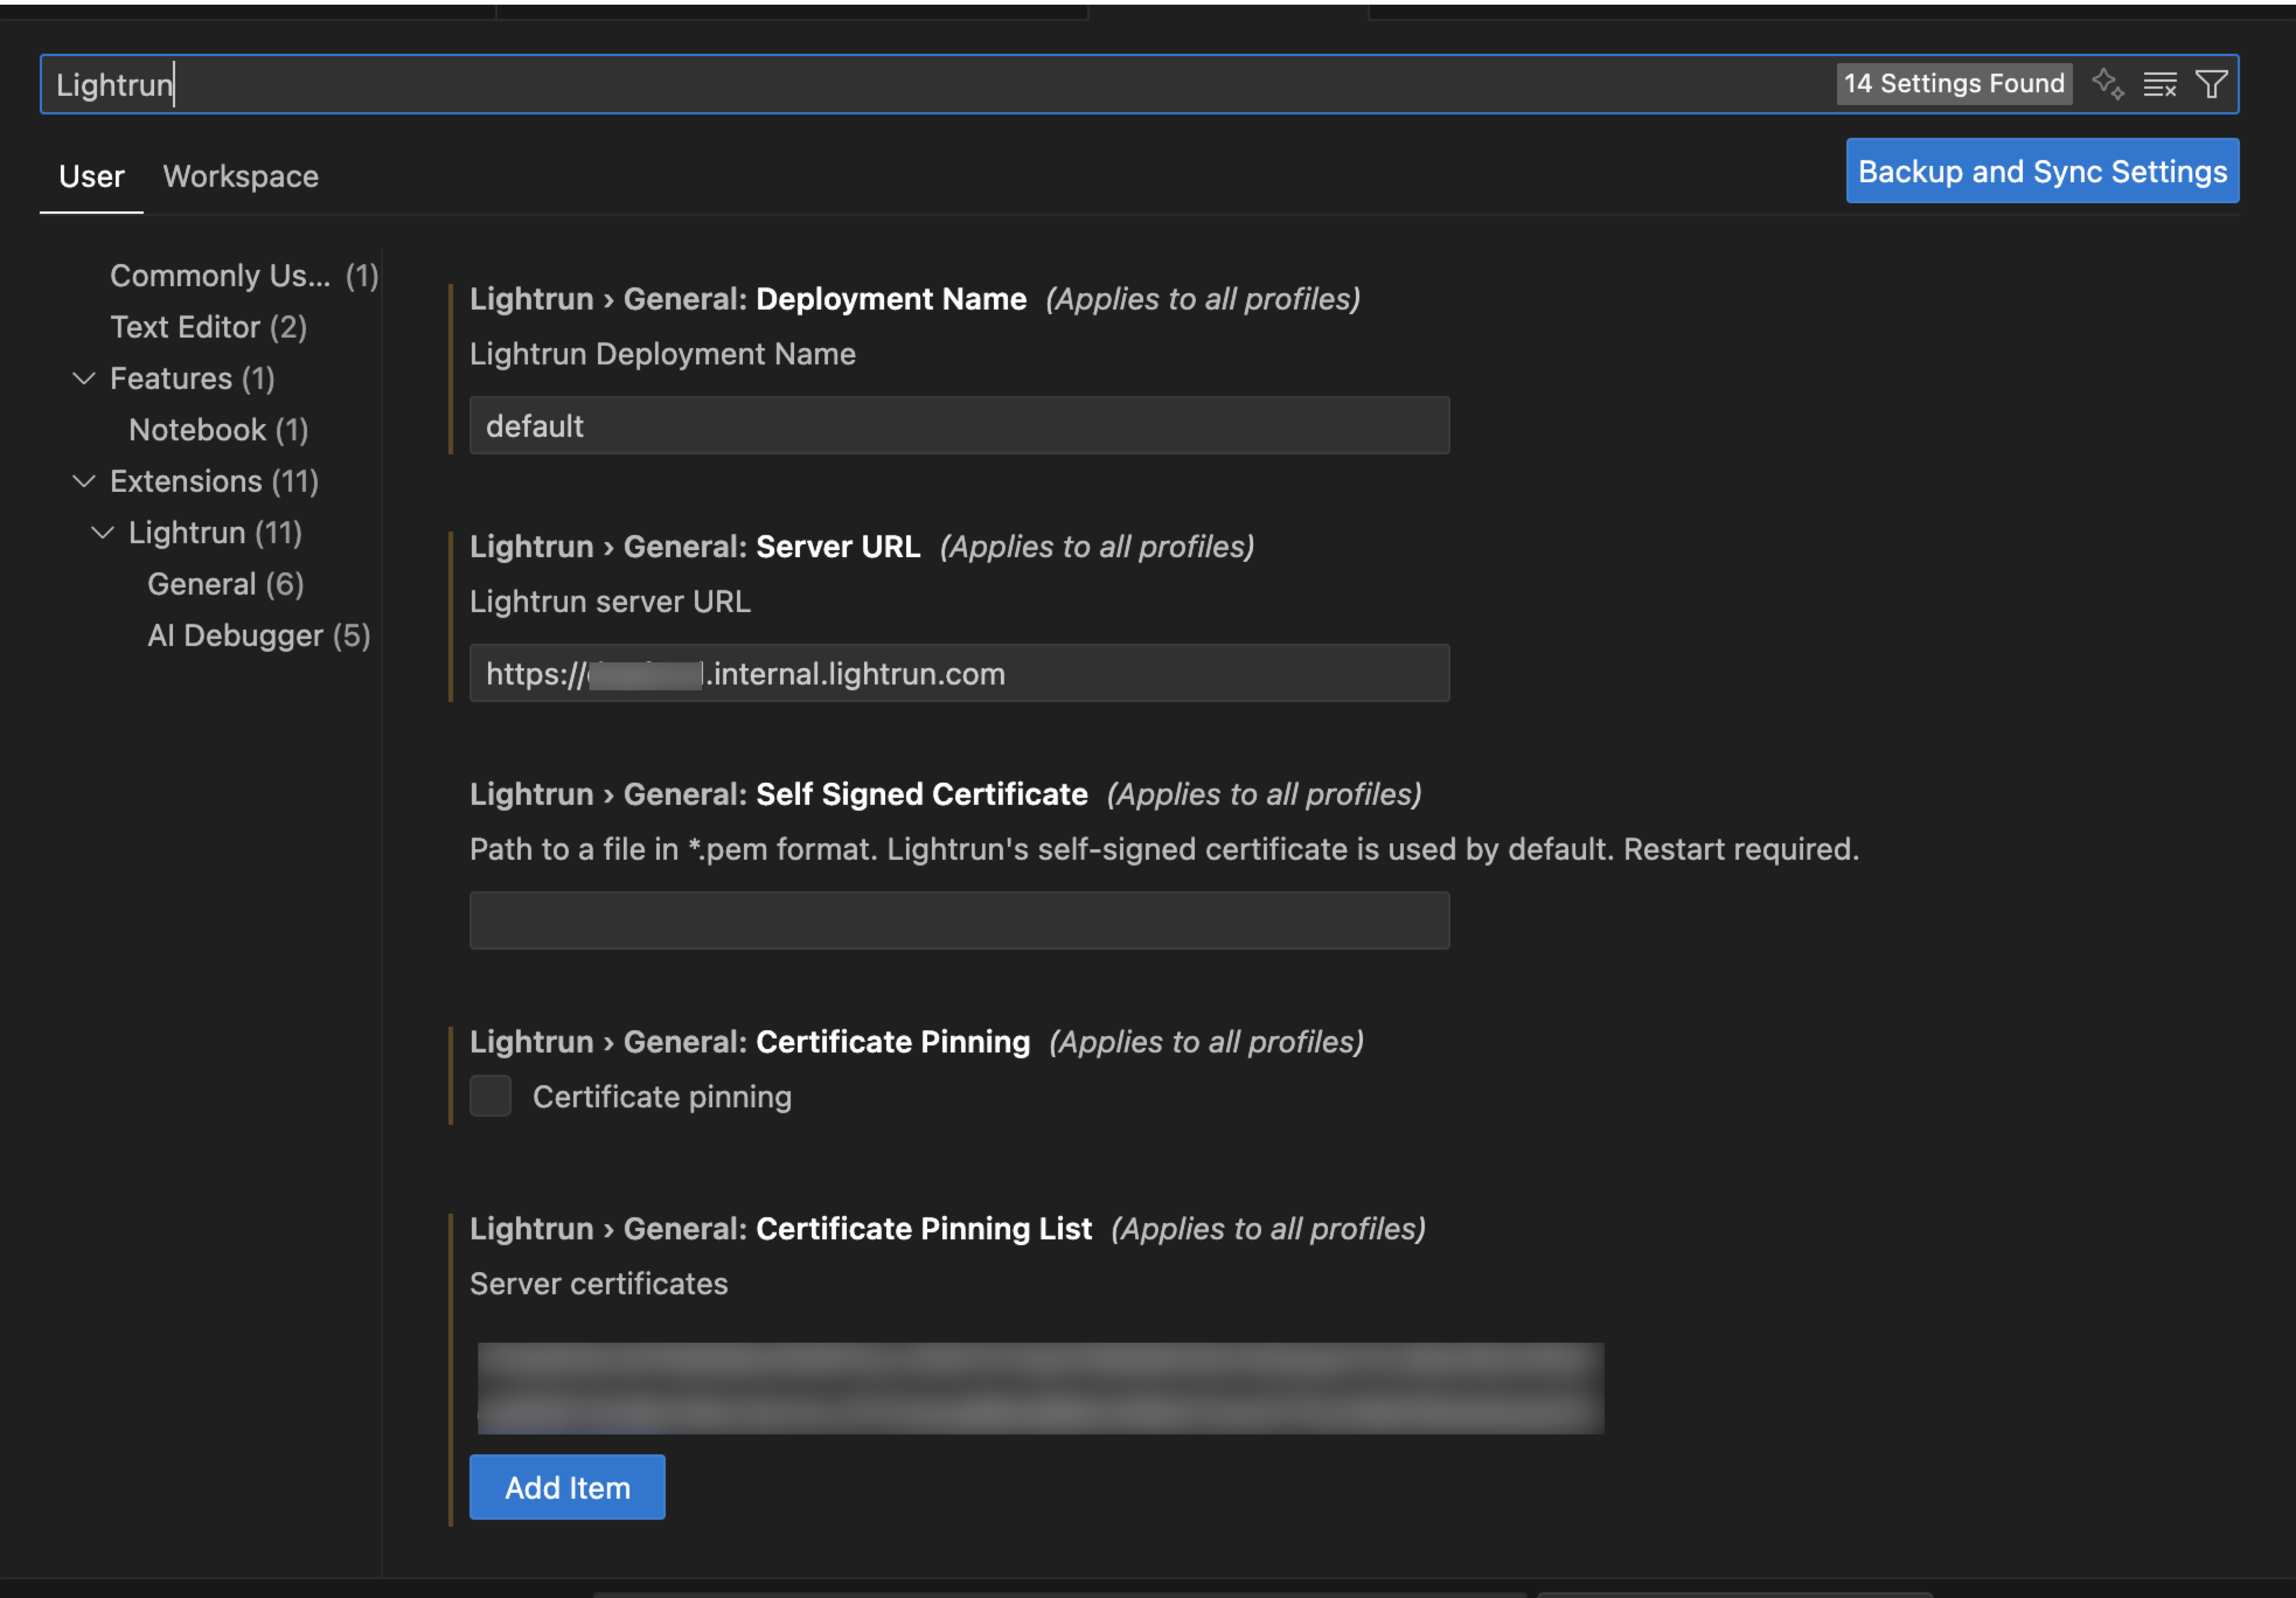
The settings page opens.
The fields are populated with data that was generated during authentication with your organization's server.
The following table describes the parameters:
Field Description Deployment Name Default deployment associated with your Lightrun account. Server URL Automatically filled with your organization’s Lightrun server. Self Signed Certificate Optionally specify a .pem file if you’re not using Lightrun’s default certificate. Certificates Pinning Disabled by default. When enabled, allows you to add sha256 public keys to verify your TLS/SSL connection.
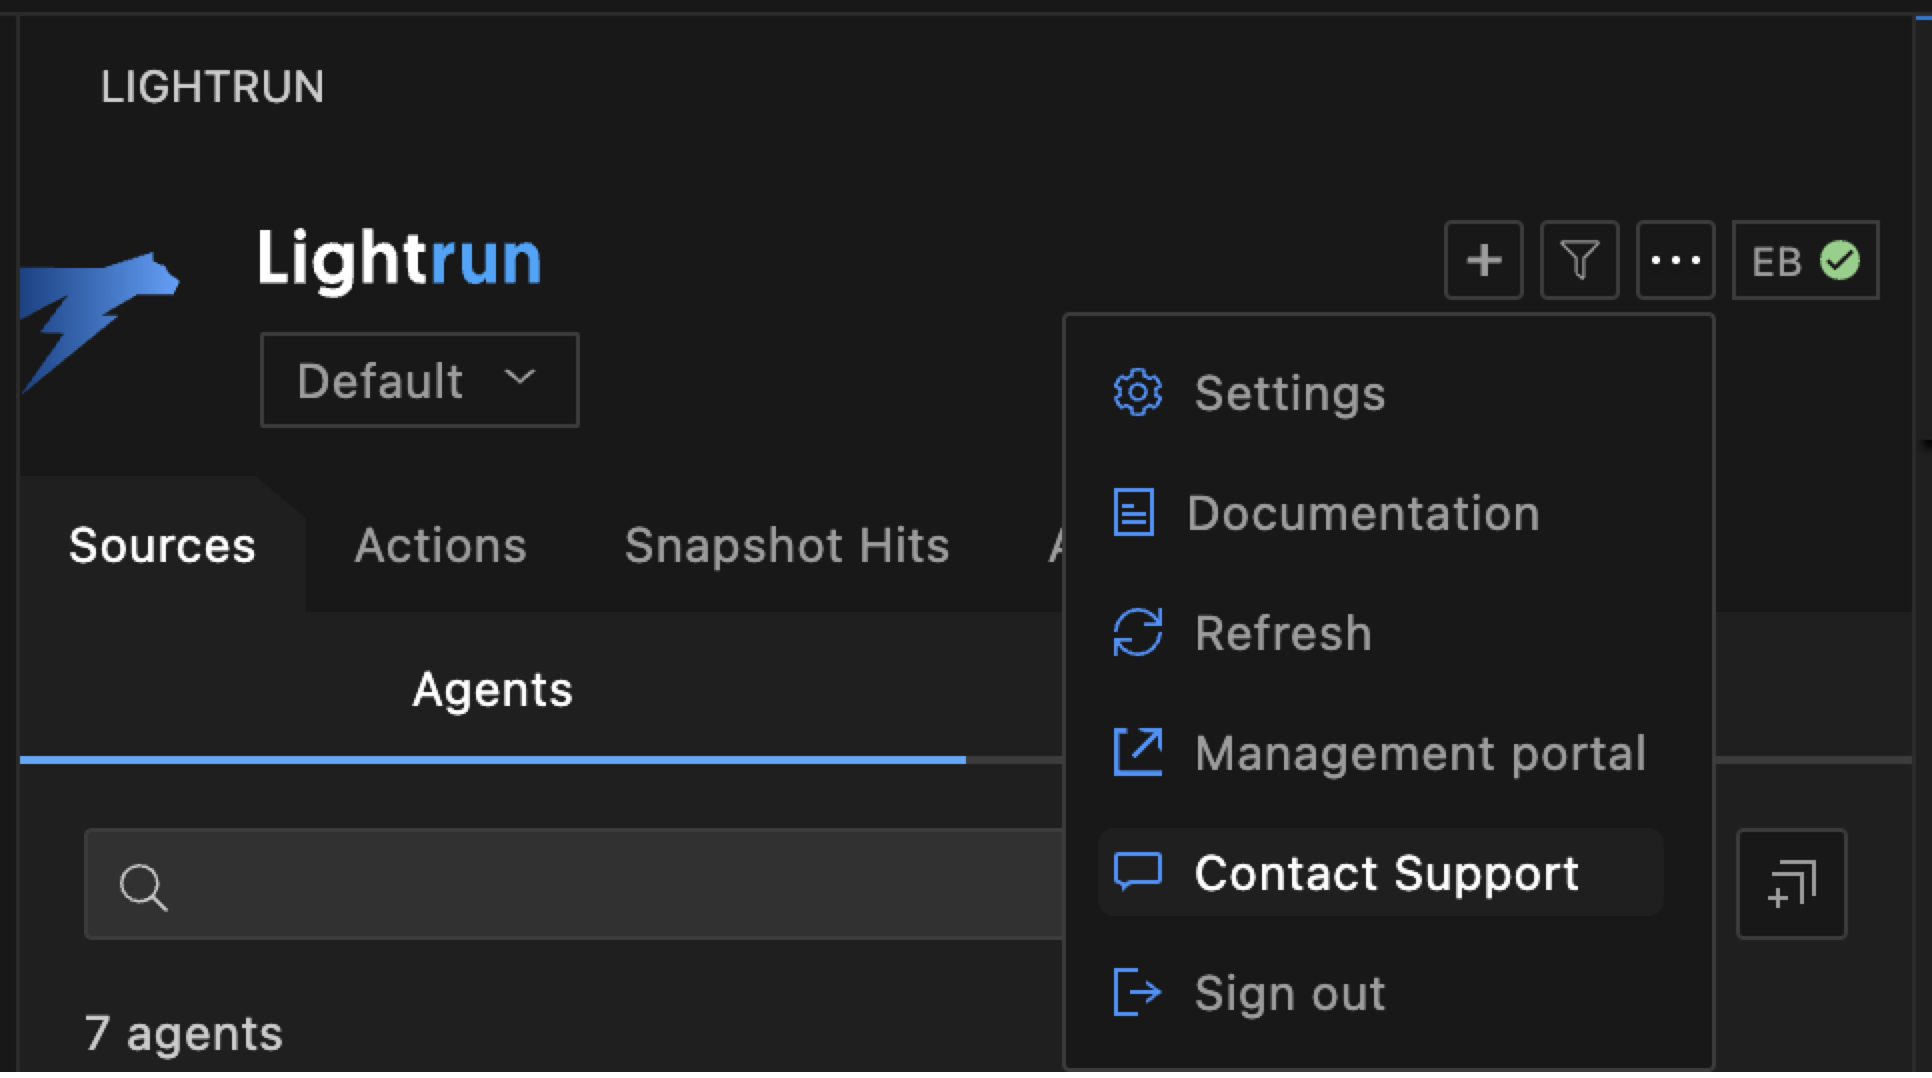
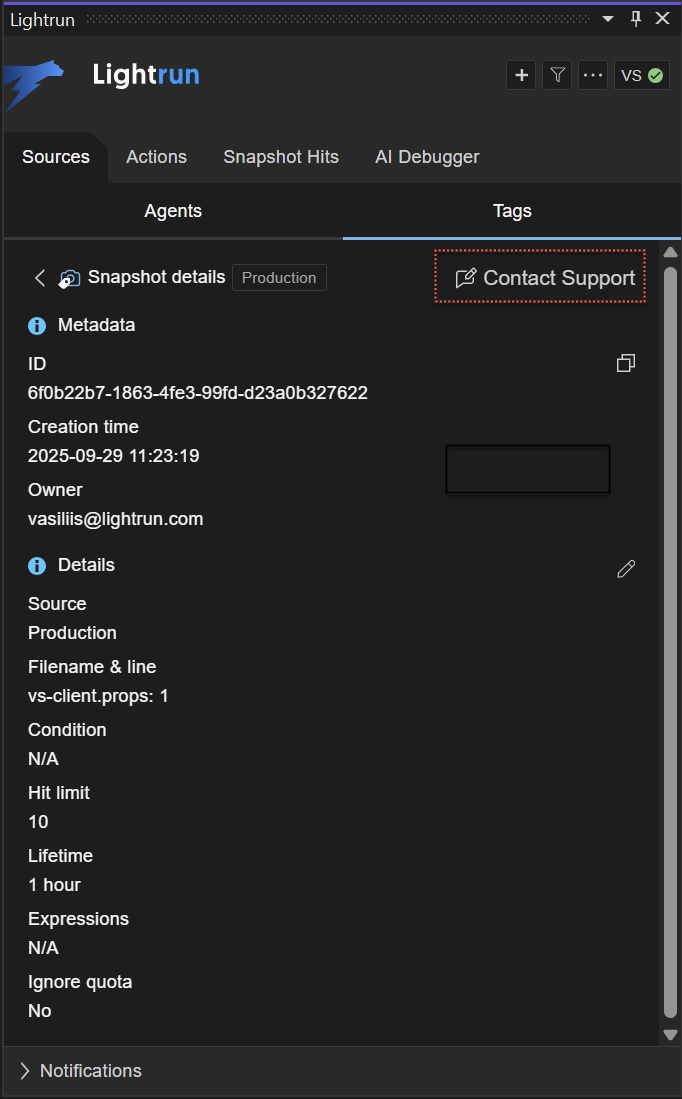
Submit a Support ticket🔗
Starting from version 1.69, you can submit a Support ticket directly from the plugin. Describe the issue in the form, specify the project type, and optionally attach additional files. Plugin logs are automatically collected and included with the ticket to help the Lightrun Support team diagnose and resolve issues more efficiently.
Note
The Contact Support feature is not available if certificate pinning is enabled.
To use this feature, temporarily disable certificate pinning or contact your administrator for assistance.
To submit a support ticket:
- Log in to the Lightrun plugin.
-
Access the Contact Support form using one of the following methods:
-
From the plugin main menu, click the More options icon and select Contact Support.
-
From the Action info dialog under the Findings field, click the issue Link.
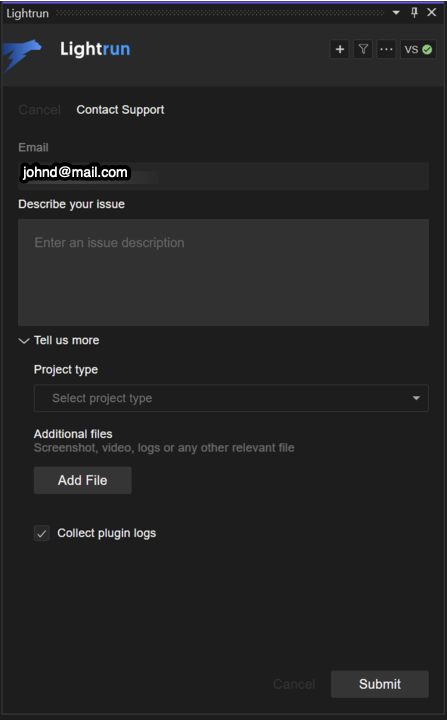
The Contact Support form opens.
-
-
Your email is automatically populated in the Email field. If you are not logged in, you will be required to enter your email manually.
-
[Mandatory] Enter your issue in the Describe your Issue box.
- Click Tell us more to provide detailed information about your issue.
- Under the Project type field, select your project type: Java, Python, .NET, or Node.js.
- In the Additional files field, click Add File to attach up to 5 files, each up to 10 MB in size.
- [Optional] Select the Collect plugin logs check box to disable collecting plugin logs. The Collect Plugin logs option is set by default.
-
Click Submit.
You’ll see a confirmation message, and the Lightrun Support team will contact you shortly.
Main tabs🔗
There are the following tabs in the Lightrun plugin:
Selecting any of the these tabs exposes additional menus and options, respectively for managing Agents and Tags, Lightrun actions, Snapshot hits, and the AI Debugger.
Sources tab🔗
The Sources view tab exposes additional menus and options for managing your Lightrun agents, tags, and custom sources directly from your VSCode IDE.
There are two subtabs in the Sources tab.
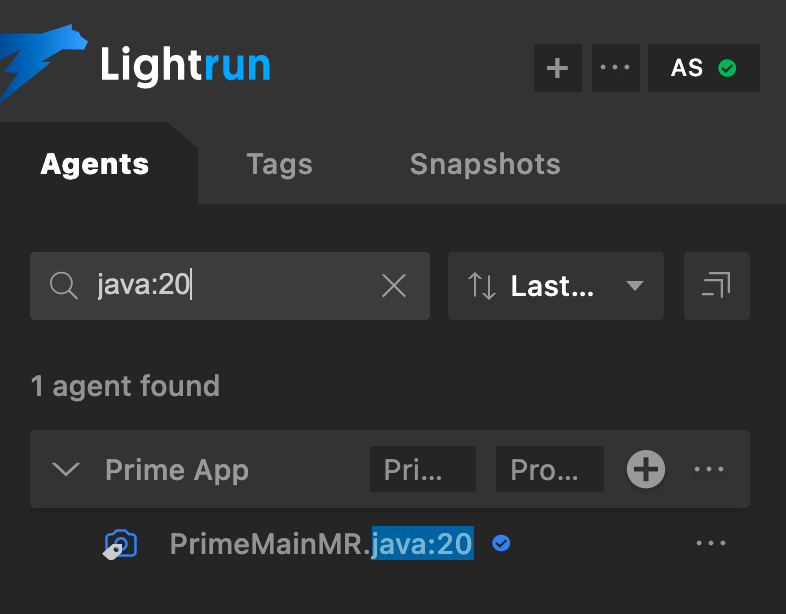
Agents subtab🔗
The Agents subtab displays a list of live agents running alongside your applications. The Agents subtab appears similar to the following image:
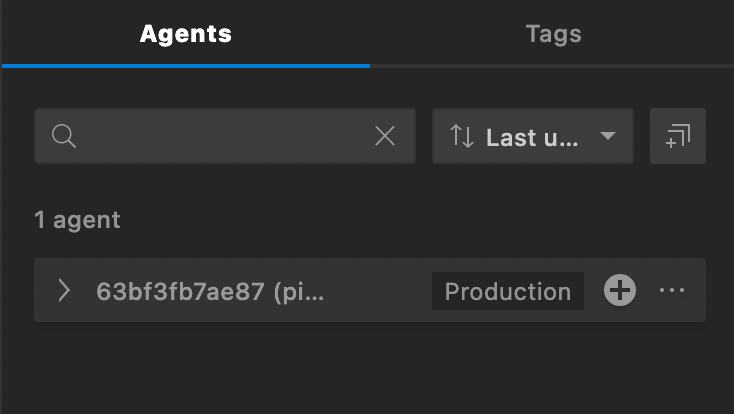
Click the expand icon ![]() on an agent to display the actions assigned to the agent.
on an agent to display the actions assigned to the agent.
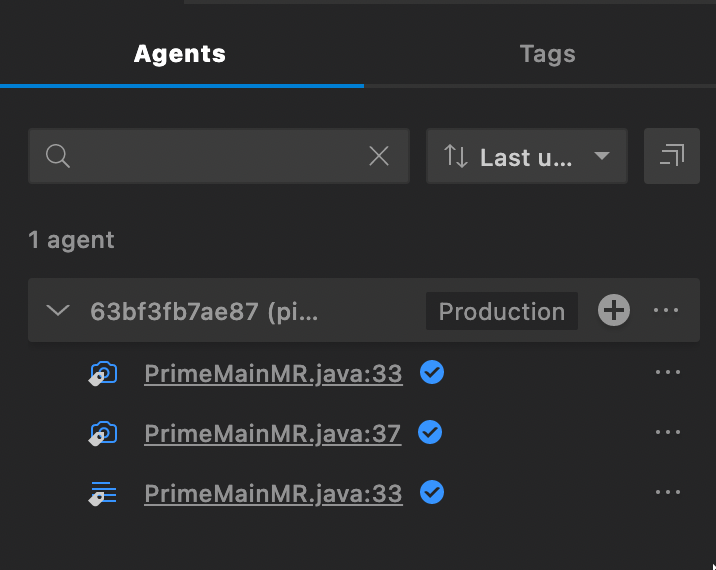
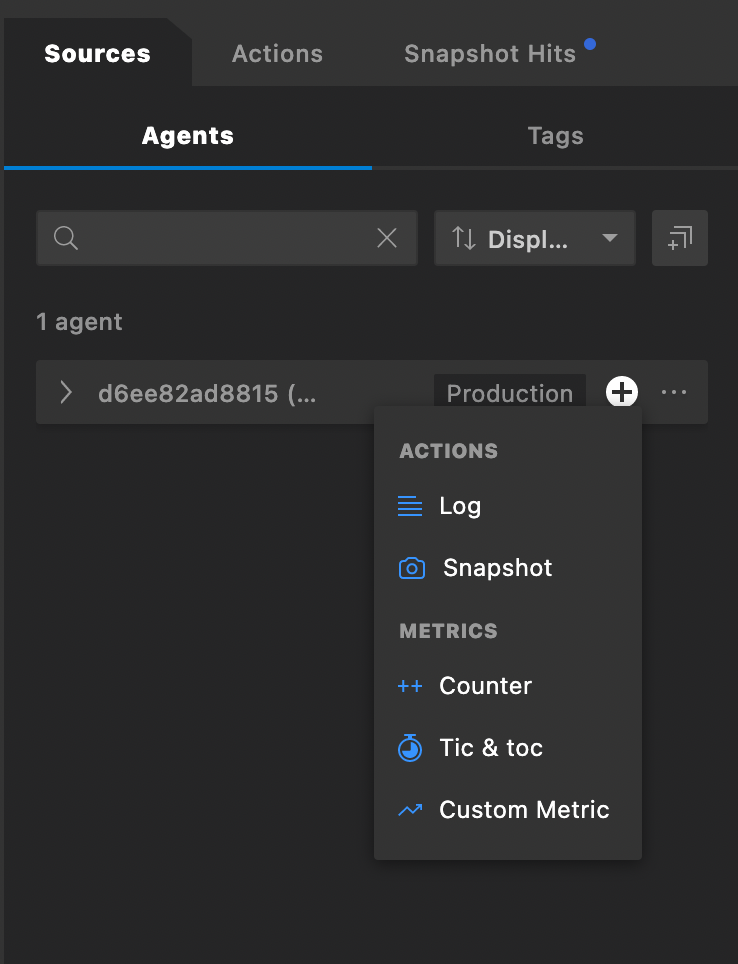
Click the add icon  on an agent to add an action to the agent.
Click the menu icon ![]() to display the AGENT OPTIONS menu.
to display the AGENT OPTIONS menu.
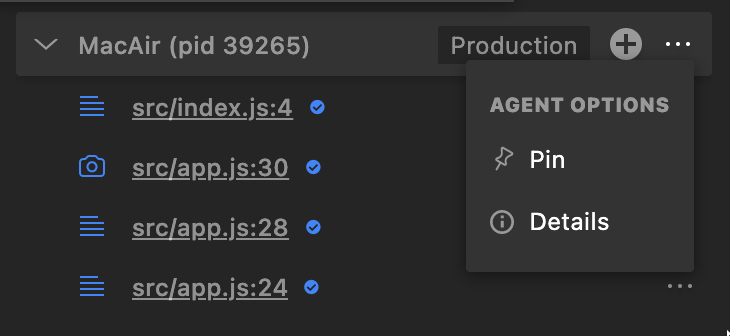
Select Pin to pin the agent to the top of the Agents subtab or select Details to view more information about the agent.
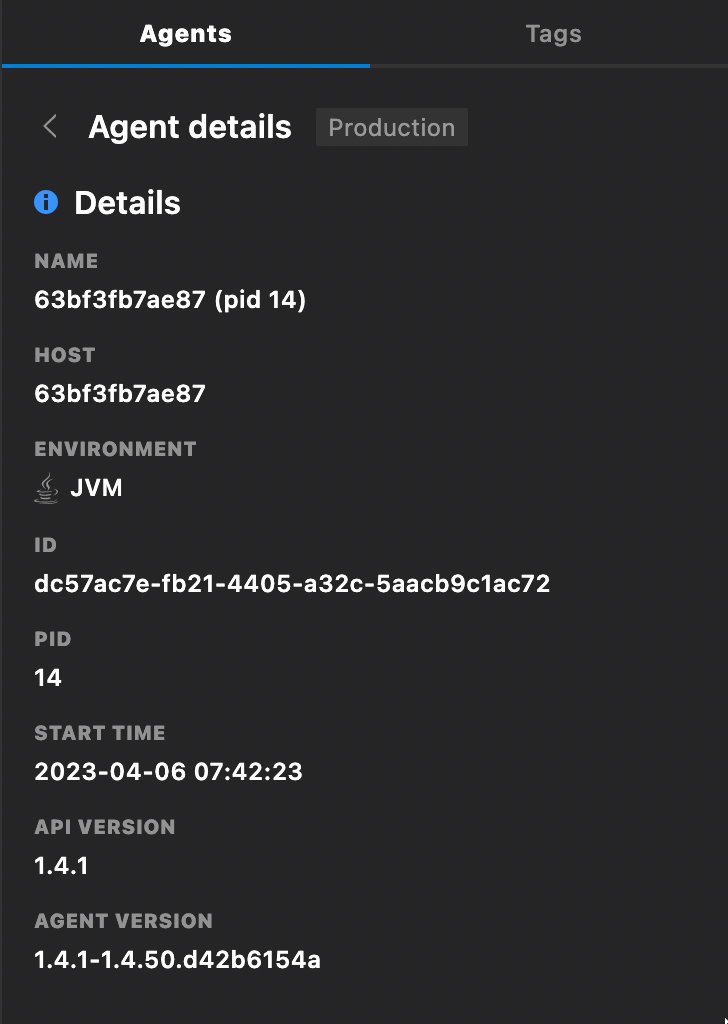
The following table summarizes the information displayed in the Agent details window.
| Field | Description |
|---|---|
| Name | The agent's display name or host name if not specified |
| Host | The name of the machine where the agent is running |
| Environment | The runtime environment of the application with which the agent is running |
| ID | A unique identifier, automatically generated for the agent |
| PID | The process ID (on the machine where the agent is running) |
| Start Time | The time at which the agent started running |
| API Version | The version number of the server the agent is connected to |
| Agent Version | The version number of the agent |
| Tags | Next to Agent details, the names of tags that have been applied to the agent. If there are more than one tag, additional tags are displayed by clicking the  icon. icon. |
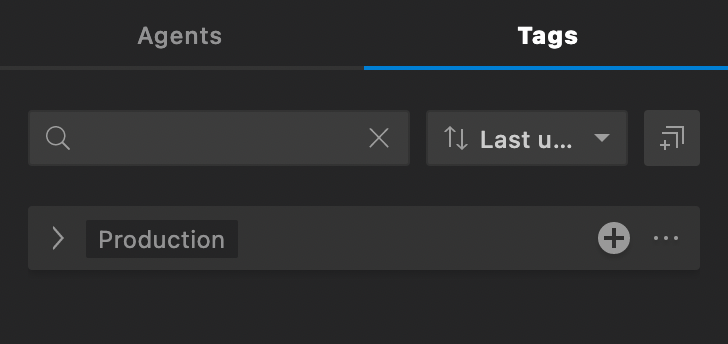
Tags subtab🔗
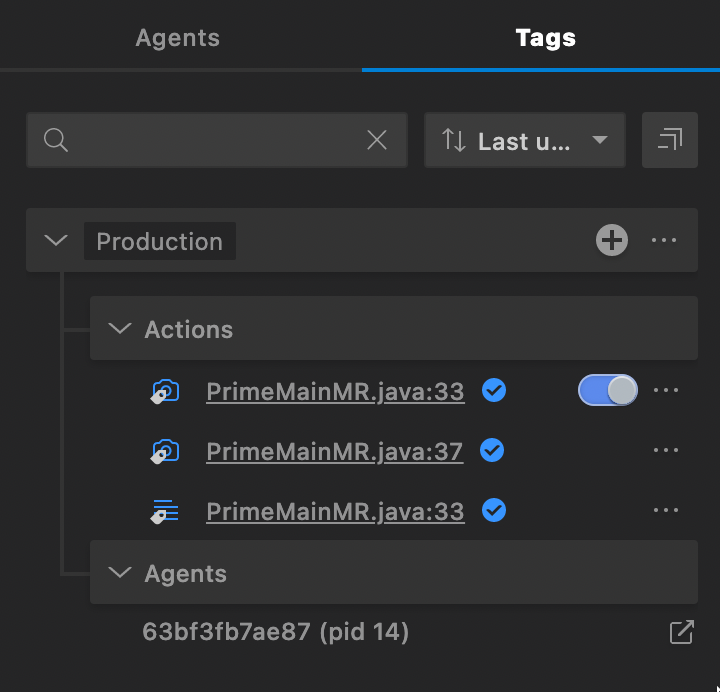
The Tags subtab lists all available tags with their associated agents and actions. The Tags subtab appears similar to the following image.
Click the expand icon ![]() on a tag to reveal the agents and actions associated with that tag.
on a tag to reveal the agents and actions associated with that tag.
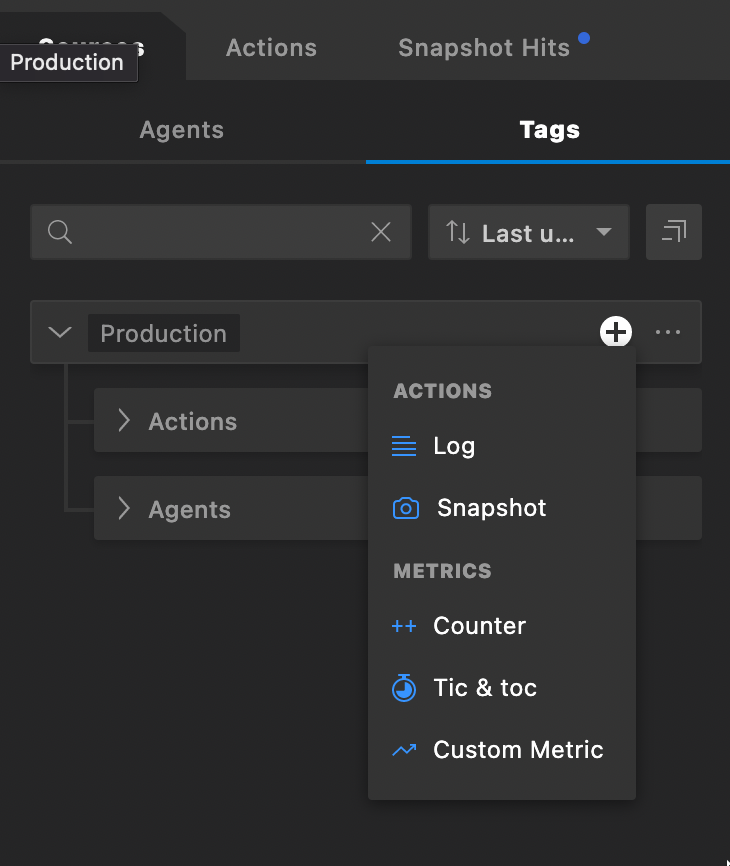
Click the add icon on a tag to add an action to the tag.
Click the menu icon ![]() to display the TAGS OPTIONS menu.
to display the TAGS OPTIONS menu.
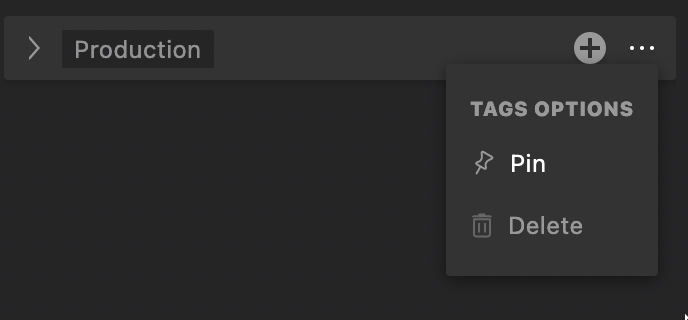
Select Pin to pin the tab to the top of the Tags subtab or select Delete to delete the tag.
Sources dynamic search filter🔗
From the sources dynamic search field, you can search for Logs, Snapshots, and Metrics attached to specific agents or tags. As you begin typing, the list of relevant agents updates dynamically.
Tip
Sources dynamic search is particularly useful for finding specific dynamic Logs, when working with multiple agents and tags.
Actions tab🔗
The Actions tab lists all Lightrun actions (Logs, Metrics, and Snapshots) currently attached to your code. This includes active actions, disabled actions, expired actions, and actions with errors.
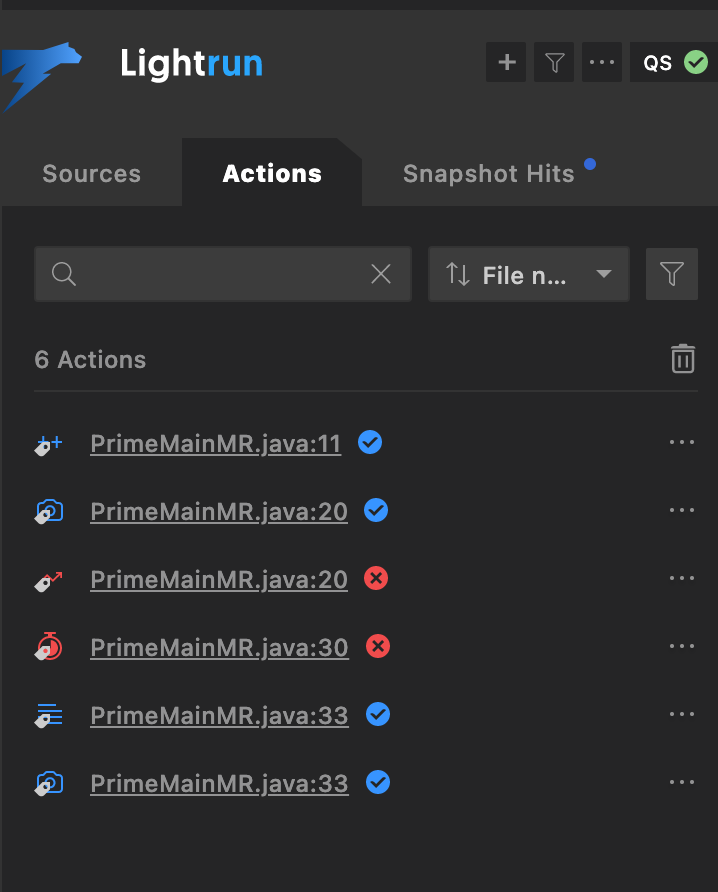
Click the menu icon ![]() to access the ACTION OPTIONS menu.
to access the ACTION OPTIONS menu.
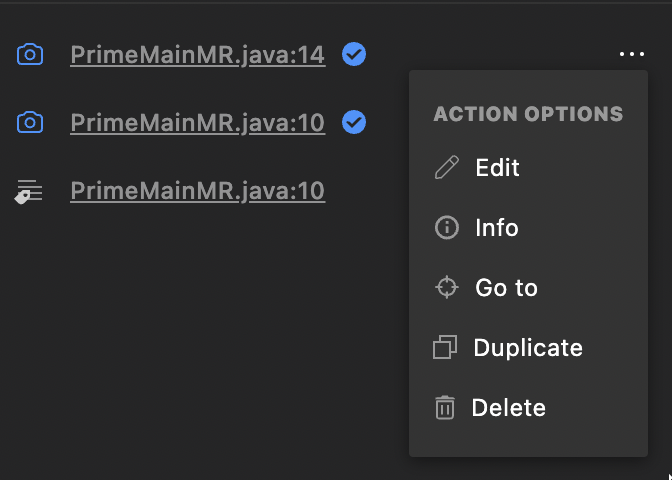
- Click Edit to edit an action.
- Click Info to view more information about the action.
- Click Go to to navigate the VSCode code editor to the action file and code line.
- Click Duplicate to create another copy of the action.
- Click Delete to delete the action.
Actions dynamic search filter🔗
The Actions dynamic search filter allows you to search for Lightrun actions using their names, agent names, filename, or code line. You can also sort the action tab with the Filename and Creation time options, or filter with the All, Active, Expired, and Error statuses.
As you start typing, the search filter will update the action list dynamically.
Snapshot Hits tab🔗
The Snapshot hits tab allows you to view and manage the snapshot hits captured in your system.
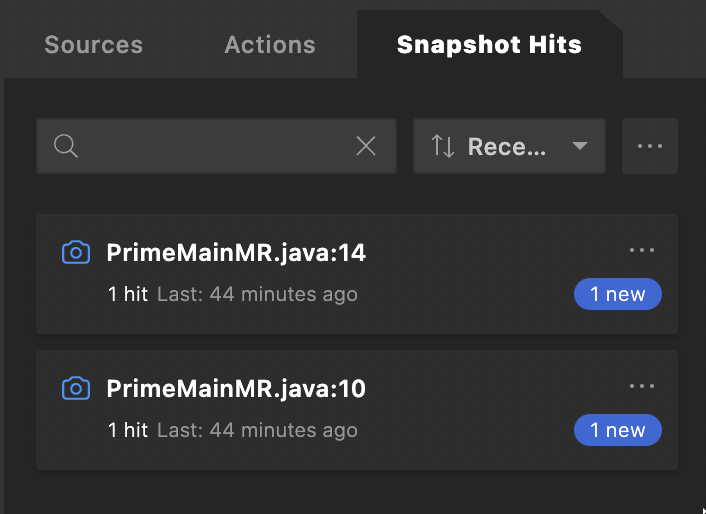
Use the dynamic search filter to filter snapshots base on their names, agent names, filename, or code line. You can also sort the snapshot hit tab with the Name, Start time, and Recently hit options, or load snapshot hits from an external file.
Click on a snapshot hit to view more information about the hit.
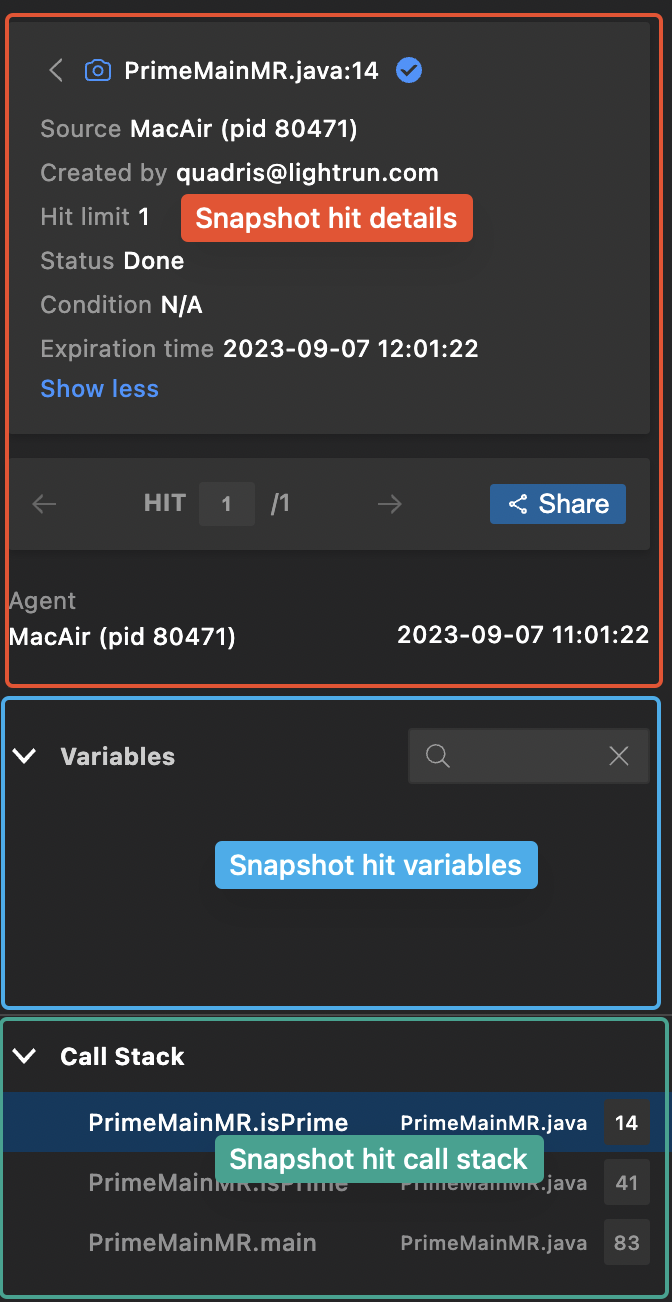
The snapshot hit data is divided into three sections.
| Sections | Description |
|---|---|
| Snapshot hit details | View more information about the snapshot. |
| Snapshot hit variables | View snapshot stacktrace variables. |
| Snapshot hit call stack | View snapshot stacktrace call stack (frames). |
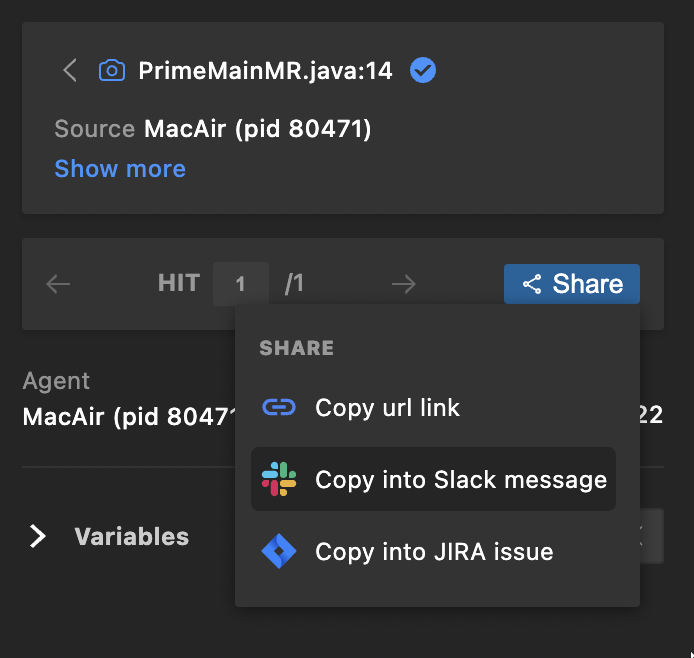
- Click Share button to share the snapshot's data.
- Click on a call stack to navigate to the hit's source code and line.
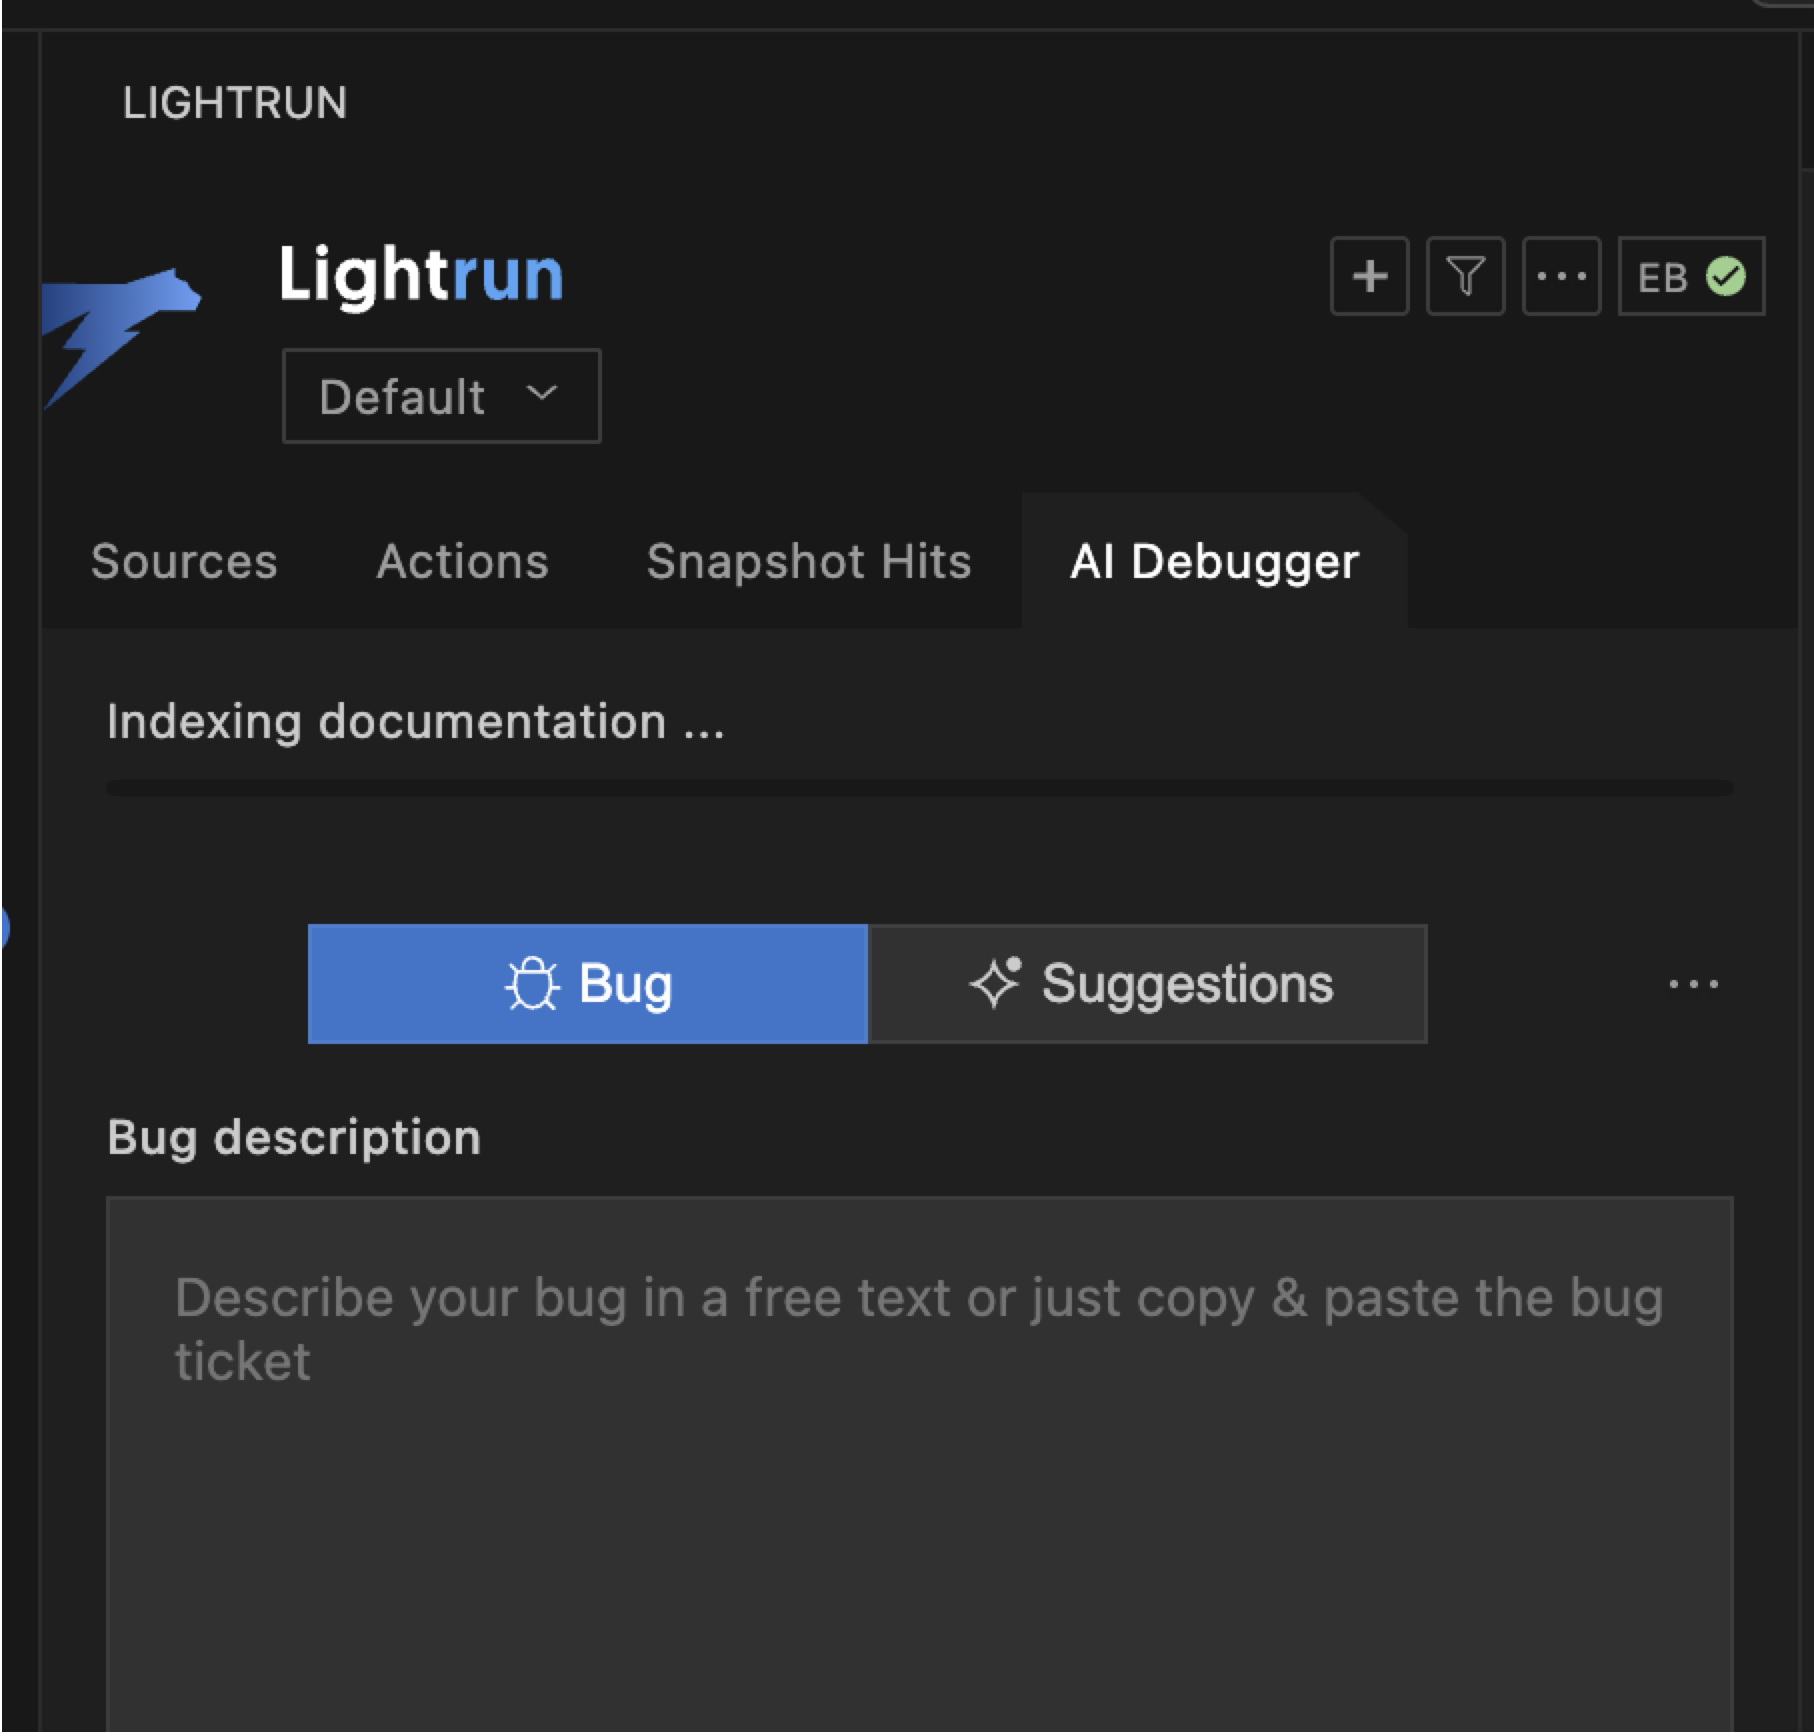
AI Debugger tab🔗
Note
Available on demand in VS Code IDE from version 1.63 for Java, JavaScript, TypeScript, .NET and Python applications.
The Lightrun Autonomous Debugger is located in the AI Debugger tab in the Lightrun VS Code plugin.
After your Admin enables the AI Debugger globally, the AI Debugger tab displays two main sub tabs:
- Bug: Enter a description of your bug.
- Suggestions: Lightrun AI-generated suggestions based on the bug you report and the project files that were indexed.
For more information, see Debug using the Lightrun Autonomous Debugger in VS Code.
Lightrun Console🔗
The Lightrun Console lets you view and interact with data from dynamic logs and metrics directly from within your VSCode IDE.
Note
Data from dynamic logs and metrics only appear in the Lightrun Console when you set their target configuration to Plugin.
The Lightrun Console appears similar to the following image.
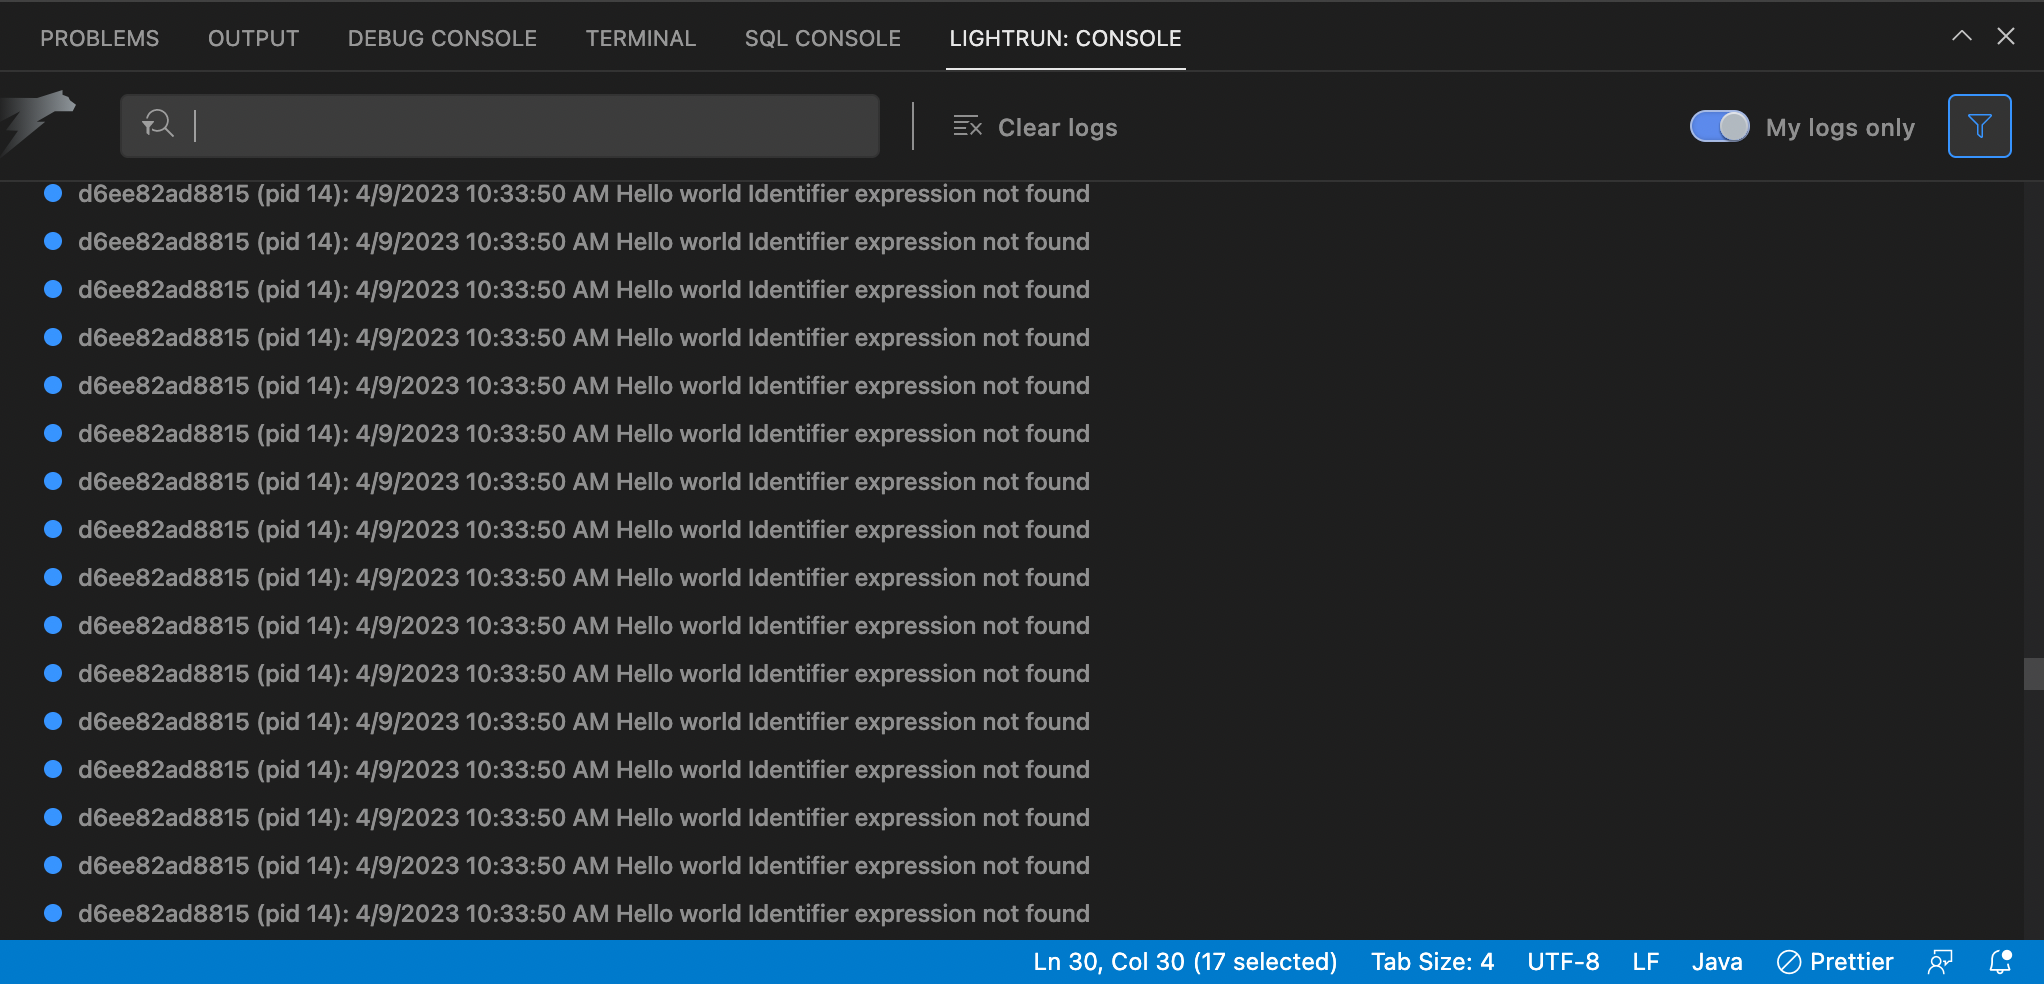
- Enter an agent's name into the console’s search bar to display only data from logs and metrics associated with the agent alone.
- Click Clear logs to clear the entire console, and use the My Logs only toggle button to configure if you want to view actions created by you alone or actions created by other members of your team in the Lightrun Console.
- Right-click on a log, and click Go to to navigate to the log's source code and line.