.NET troubleshooting guide🔗
Sometimes issues may arise that interfere with smooth running. We've done our best to gather a list of some more common issues and possible solutions.
System error messages🔗
| Error | Description | How to fix |
|---|---|---|
Certificate Pinning failed. | When running the VS Code plugin, you may encounter this message if you have a Proxy enabled. | Try the following:
|
Evaluation is skipped. Reason: N/A, (...) | This error can be encountered when evaluating an expression. .NET agent has a Sandbox feature that ensures that the evaluation of properties and methods can't influence the application state. However, the Sandbox can't run an unsafe code, producing this error. | Try the following:
|
To enable LightrunAgent set Environment Variable (...) | In order to run the Lightrun Agent properly, its native component should be loaded as a .NET profiler. This is done by setting the relevant environment variables. | Refer to the agent installation guide to setup these variables correctly. |
General issue🔗
Self-signed certificate is blocked🔗
Troubleshooting methods for this issue may vary depending on browser, browser version or operating system.
The following links address most of the certificate issues associated with popular browsers and operating systems:
Plugin issues🔗
Can't see the Lightrun plugin sidebar🔗
If you're unable to see the plugin from your IDE, verify that:
- The WebStorm or IntelliJ IDE default is not set to Collapse all.
- The Lightrun plugin is installed and active.
- Check the plugin's settings at View->Tool Windows->Lightrun.
Can't sign in from the plugin🔗
Symptoms
- No connectivity to server (cloud).
- The IDE cannot connect to the server (in Lightrun Cloud deployments or when using app.lightrun.com)
Suggested solutions
Resolve server URL mismatch. Check the Lightrun server URL in the plugin's settings (under the IDE's Preferences / Settings --> Lightrun) and verify that it's the same URL that appears in the browser page from which you're trying to authenticate.
Can't sign in from the browser for the plugin or CLI🔗
If you Unable to log in from your browser, check the following issues:
- Verify that the client can communicate with the server (the cloud).
- There may be a problem with the embedded browser in your IDE - From the Lightrun plugin settings menu in the WebStrom or IntelliJ IDE, disable the Use Embedded Browser option and then try logging in again.
Agent issues🔗
Agents don't appear in the Agents tab in the Lightrun sidebar🔗
If agents don't appear in the plugin, it may be because they are not running on the server where your application is located. If you're sure the agent is running, then the error could be due to connection or authentication issues at the client side.
If you are unable to see agents in the IDE, try the following:
-
Validate that you have selected the correct agent pool.
-
Restart the IDE.
If the agents still fail to appear, contact your administrator for assistance.
Where to find agent log files🔗
- On macOS and Linux: Located in the
/tmpfolder. - On Windows: Located in the
%TEMP%folder.
Action issues🔗
Unable to see dynamic logs in my IDE🔗
Logs only appear in the IDE if piping is configured correctly in the Lightrun plugin. If you are unable to see any logs:
- Verify that the piping configuration is set to either Plugin or Both.
Unable to create a new action🔗
Symptoms
- You're unable to create a new action.
- An action you create appears red in the IDE.
- The only actions that appear in the IDE are for tags.
- You're unable to find the agent list in the Lightrun plugin.
Suggested solutions
- Verify that you're logged in. Try logging out and then logging back in.
- Verify that you're attempting to insert the action from a line with code in it.
- From the IDE, verify that the cursor is positioned within your code. From the CLI, verify that the line number you used is valid.
- The agent might be down. Ask your account manager to check.
- You're not connected to the correct source code version (the same version currently running with the agent). Try closing the source code and reopening the file, ensuring you open the file directly from the correct source version.
- Your plugin may need to be upgraded to the newest version.
Unable to delete an existing action🔗
If you're unable to delete an action, verify that:
- You're logged in.
- The agent you're using is currently running. To verify, try running
list-agents.
No code found🔗
The No code found at line # in <path> error may occur even if the action (for example, a log) is inserted at a line that contains executable code.
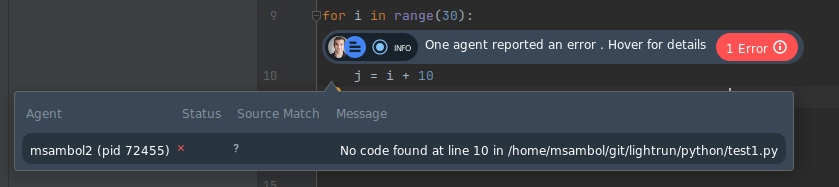
Symptoms and causes
This error typically happens when inserting a log in a code line that doesn't have executable code. The probable cause of the error is that a log action, in most cases, triggers at the line preceding the log insertion position. If the previous line is empty or contains no executable code, then the No code found error is displayed.
Suggested solution
Try moving the action insertion position to the line following the one for which the log is intended to trigger.
Failed to parse expression🔗
Failed to parse expression. The parse operation was cancelled.
Symptoms and causes
The expression couldn't be parsed, because it either contains errors, or unsupported C# syntax.
Suggested solution
Verify the expression is correct or simplify the expression.
An action is not accepted by the agent🔗
The action is not accepted by the agent, and there's no error message for it.
Symptoms and causes
This can mean several things:
- PDB file for the corresponding assembly is not found.
- The assembly, in which the action is placed, is not loaded yet.
- The filename is incorrect (e.g. typo).
- The selected action `Source` is not correct (wrong agent tag, or the custom source).
Suggested solution
Verify that PDB files are present next to .dll files of your application. Check the filename is correct, and that the action source matches the agent.
A local variable missing in a snapshot🔗
Symptoms and causes
In Release mode the C# compiler optimizes the code to increase performance.
In some cases it can choose not to create a local variable.
This is especially relevant for .NetFramework.
For example in some .NET versions this code
int GetTen()
{
    var result = 10;
    return result;
}
when compiled in Release mode, can be transformed by C# compiler to this code
int GetTen()
{
    return 10;
}
It will make impossible to retrieve the local variable value, because it doesn't exist in function IL code.
Suggested solution
Try inserting the action in different places, where the value of interest is also present. For example, the function arguments are never optimized away.
If possible, disable code optimization to get the best debugging performance.
    <PropertyGroup>
        <Optimize>false</Optimize>
    </PropertyGroup>