Generate diagnostics for your Lightrun deployments🔗
Required Roles
| Up to version 1.69 inclusive | From version 1.70.4 and higher |
|---|---|
ROLE_MANAGER | Company Admin |
Note
The Diagnostics page replaces the Lightrun logs collector page in the Lightrun Management Portal. This deprecation applies to on-prem environments starting from version 1.51 and SaaS environments starting from version 1.53.1.
Starting from version 1.50, you can generate and download a comprehensive set of diagnostic reports in JSON format. The reports contain detailed technical information about your Lightrun system configuration, diagnostic data, infrastructure setup, and basic usage metrics. These reports provide crucial insights that help Lightrun enhance support for our customers.
Important
All sensitive information in the reports is redacted.
Generating these reports helps with troubleshooting your Lightrun setup within your organization. Reports are downloaded as a system_diagnostics.zip file, organized by category, and saved locally to your computer. Each category is stored in a separate JSON file.
In the System Diagnostics page in the Lightrun Management Portal, you can select the type of report to generate based on the following main categories:
Note that starting from version 1.57, on-premise users with the ROLE_MANAGER, or Company Admin from version 1.70, are treated administrators and have full permissions to generate all report types.
- General Information – Available to admins only
- Server Logs – Available to all users
- Agent Logs – Available to all users
- Plugin Logs – Available to admins only
List of available reports🔗
Reports are generated and displayed as JSON files, categorized by Lightrun roles:
- Admins have access to all reports.
- Managers have access to manager-level reports as well as user reports.
- Users have access only to user reports.
Admins (Includes all reports)🔗
FEATURE_TOGGLES.json– Lists all feature flags, their enabled/disabled status, and associated parameters.ENVIRONMENT_VARIABLES.json– Lists environment variables set on the Lightrun server. Sensitive information is redacted.KEYCLOAK.json– Export of Keycloak parameters configured in the system. Sensitive information is redacted.DB_TABLES_INFO.json– Lists Lightrun database details, including size and table names. Data within the tables is not included.SERVER_LOGS.json– Lists logs related to server operations.K8S_INFO– List system information gathered from Kubernetes API (provided that the Lightrun service has access to it) such as pod & node information . Example file:k8s-operator-controller-manager-xxx.json. Supported from version 1.54.
Managers (Includes manager and user reports)🔗
LICENSES_INFO.json– Lists agent count, user count, and license expiry date.INTEGRATIONS.json– Lists Lightrun integrations configured in the system.AGENTS.json– Lists the agent count by runtime environment and version.PLUGINS.json– Lists Lightrun plugins connected to IDEs in your organization, including plugin counts by version and IDE version.ACTIONS_INFO.json– Lists information by action type, including active action count, average hit size for logs and snapshots, max hit size, first and last hits, and total hit counts.USAGE_INFO.json– Lists the number of active users, agent pools, and usage statistics by agent pool.
Users (Access to user reports only)🔗
Aggregated usage information over last 90 days (for agents, actions, and users). User information could contain user emails and action usage could contain git-based data (such as git repo, name & tag). If the Sanitize checkbox is selected. this information will be ANONYMIZED or REDACTED.
AGENTS.json– Lists the agent count by runtime environment and version.PLUGINS.json– Lists Lightrun plugins connected to IDEs in your organization, including plugin counts by version and IDE version.
Generate system diagnostics reports🔗
- Log in to the Lightrun Management Portal.
-
Under Settings, navigate to Compliance > System Diagnostics.
-
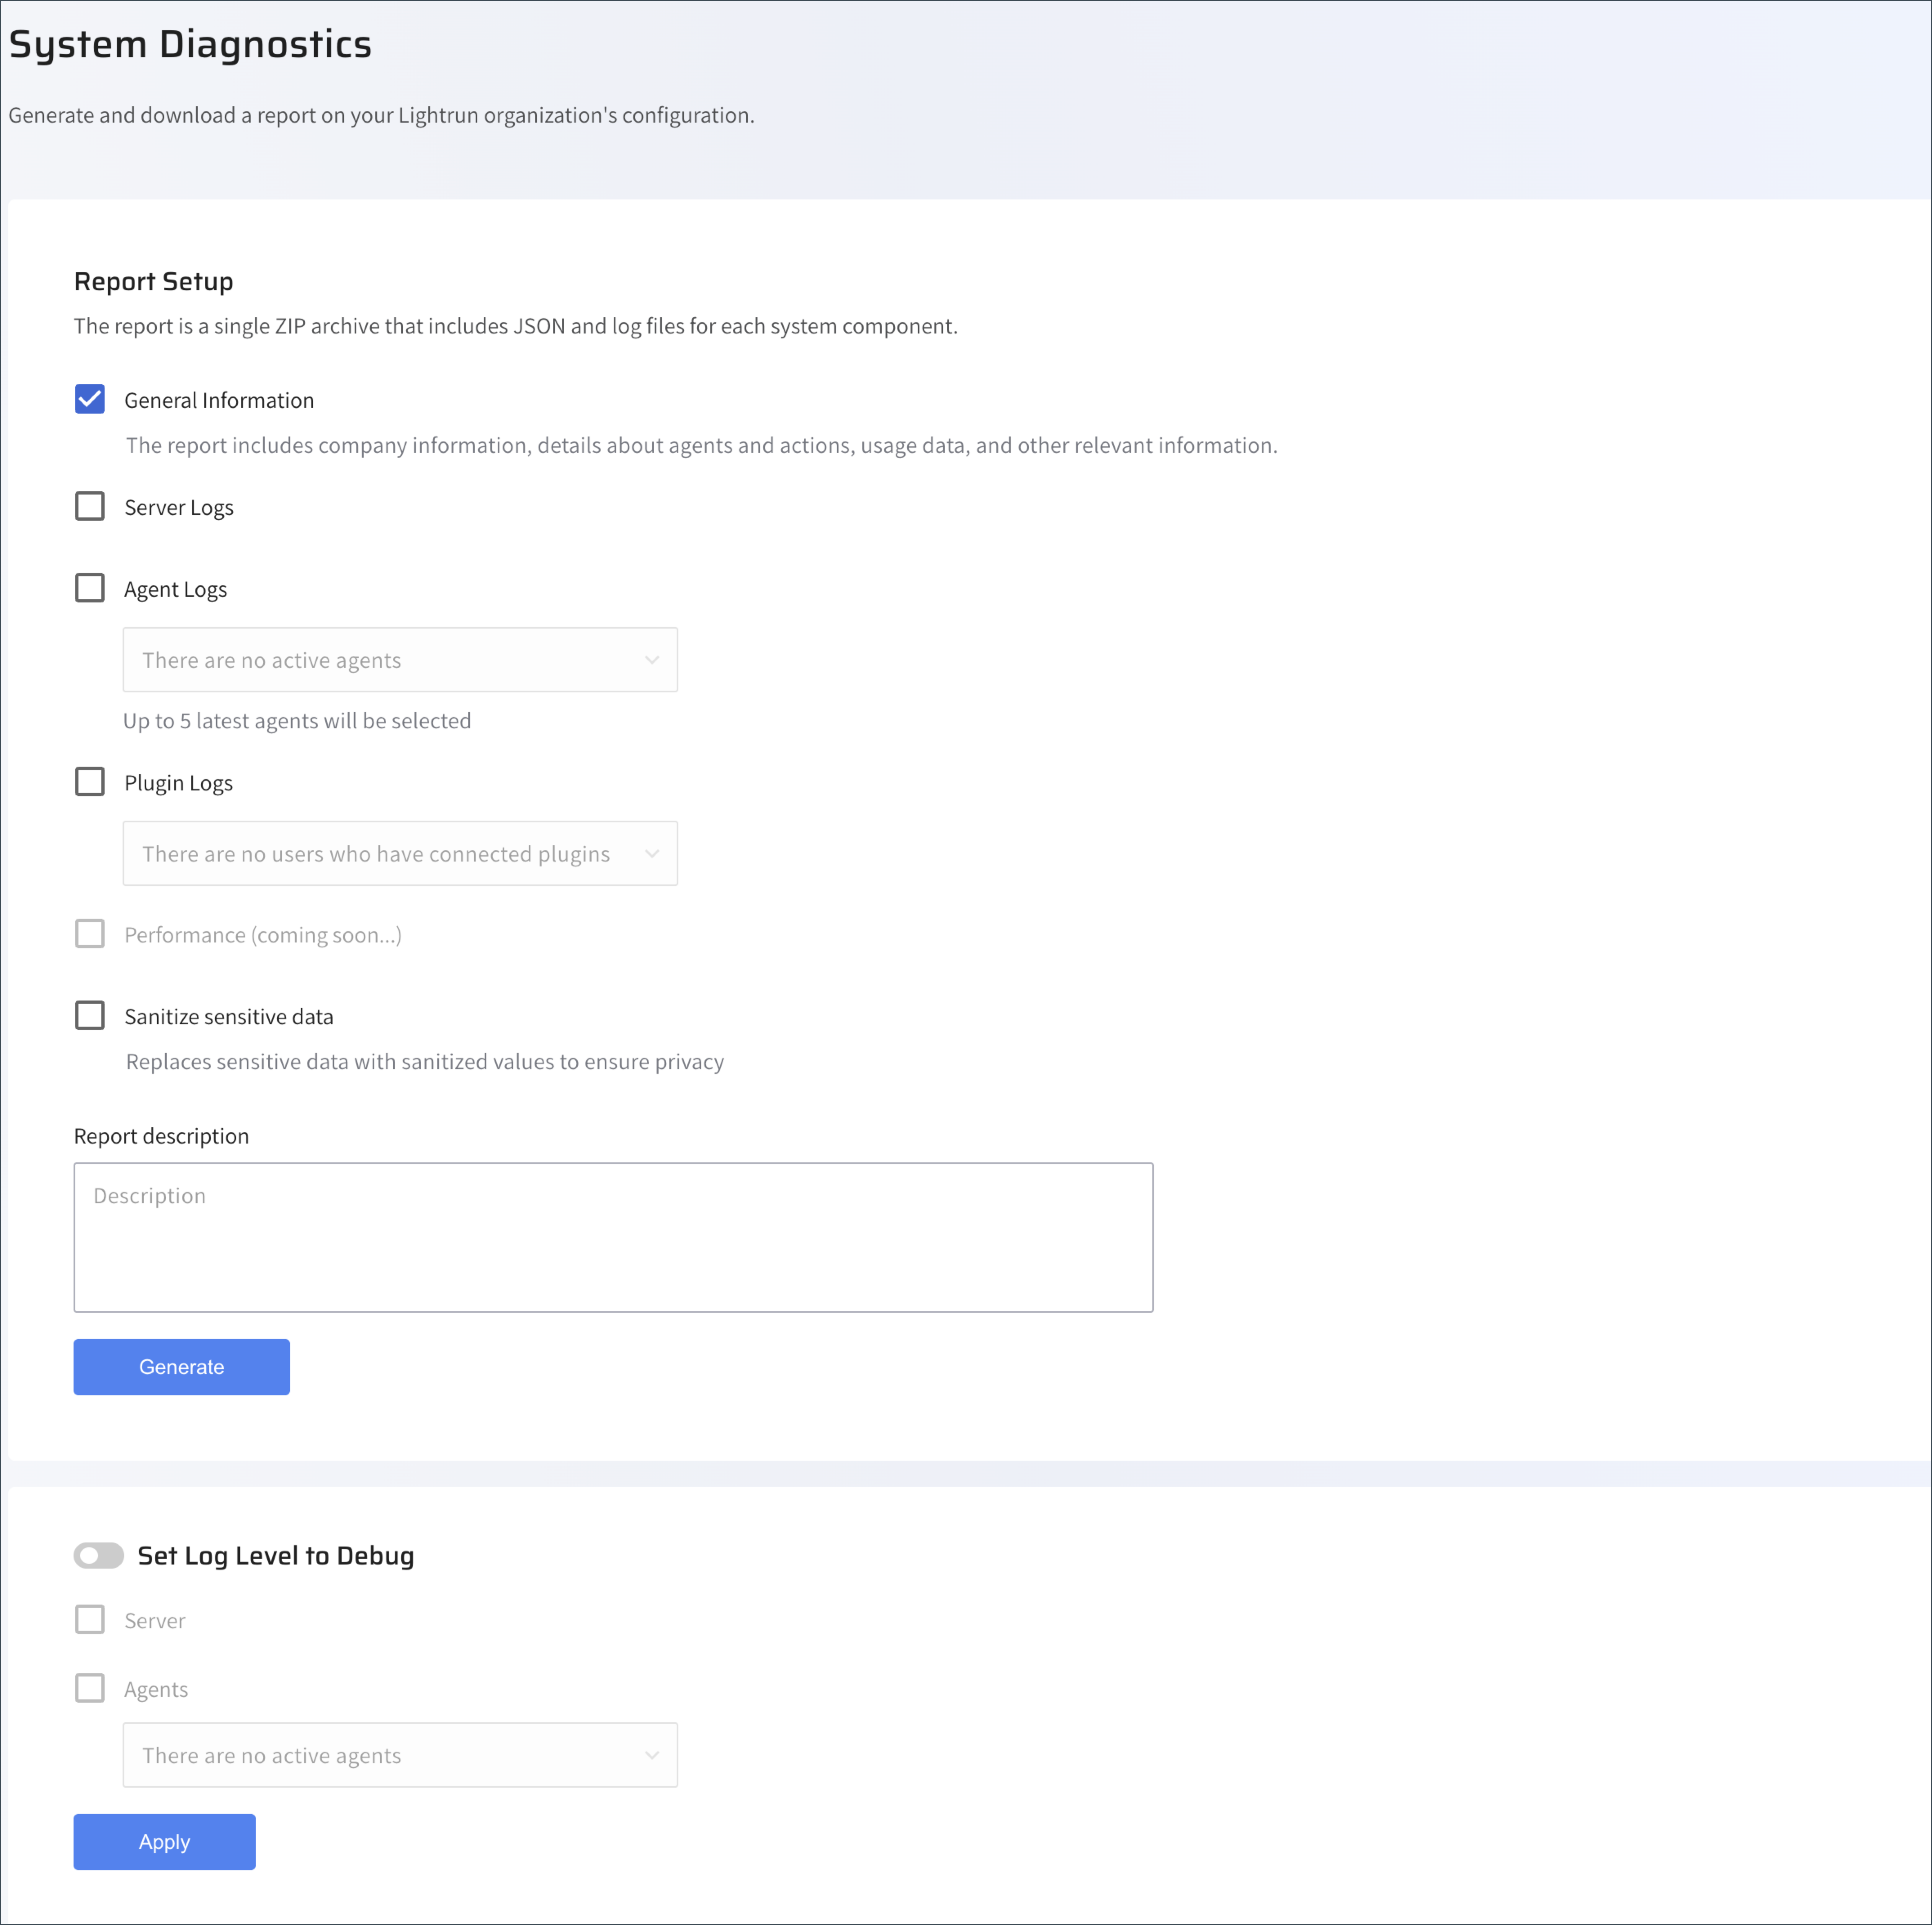
Select the categories of reports you want to generate.
The main categories available are:
- General Information
- Server Logs: Log files generated by all back-end servers that are part of the Lightrun Management Service.
- Agent Logs: Log files generated by Lightrun agents according to the requested agent filter (by tag, custom source, or agent pool). Logs from up to 5 random active agents will be retrieved. It will also include the command line arguments & environment variables (redacted) given to the agents. From version 1.61, you can search for agents from a generated list.
- User Plugin Logs: Log files from a specific user’s plugin (which must be actively connected to Lightrun during the report generation) that was selected. The log files include the plugin logs (including the IDE log files) and the Lightrun Autonomous Debugger log files. From version 1.61, you can search for plugins from a generated list.
-
[Optional] In the Report description field, enter a user-defined description that helps recognize the report later.
- [Starting from version 1.56] Select the Sanitize sensitive data checkbox to replace sensitive data with sanitized values ensuring privacy.
-
[Starting from version 1.55] Set the debug level for server logs.
As an administrator, enable the Set Log Level to Debug toggle, select Server.
-
[Starting from version 1.57] Set the debug level for agent logs. The debug level is set for all agents, bug logs are collected only from the top 5 most active agents.
As an administrator, enable the Set Log Level to Debug toggle, select Agents, and select an agent from the list.
-
click Apply.
-
Click Generate.
A message will indicate that the data is being generated.
-
Once complete, the
system_diagnostics.zipfile is displayed. -
Click the download icon to save the zip file to your local drive.