Work with Lightrun Snapshots in the JetBrains IDE🔗
A snapshot is a one-time "breakpoint" that doesn't block your code from running. As opposed to a traditional breakpoint, Lightrun Snapshots collect the stack trace and variables without interrupting the application at all.
From your JetBrains IDE, you can:
- Add a snapshot
- View snapshot data
- Capture full and deeper snapshot values: Java agent from version 1.78; Node.js agent from version 1.83.
- Edit and delete a snapshot
- Copy and paste a snapshot
- Compare snapshot hit variable values in clipboard
- Compare cross snapshot-hit variables: Supported from version 1.72.
- Export full snapshot hit data: Supported from version 1.69.
- Export snapshot hit frames and variables data as JSON: Supported from version 1.66.
- Upload snapshot hit data
- Debug Java lambda expressions in single-line code: Supported from version 1.48.1.
Prerequisites
To use the plugin, make sure you have:
- Installed the plugin in your local IntelliJ instance.
- Authenticated IntelliJ with your Lightrun account.
- Attached at least one agent to your app.
- Opened the source code file for the running application from the IDE.
Add a snapshot🔗
-
Go to the line of your source code at which you'd like to insert the snapshot.
-
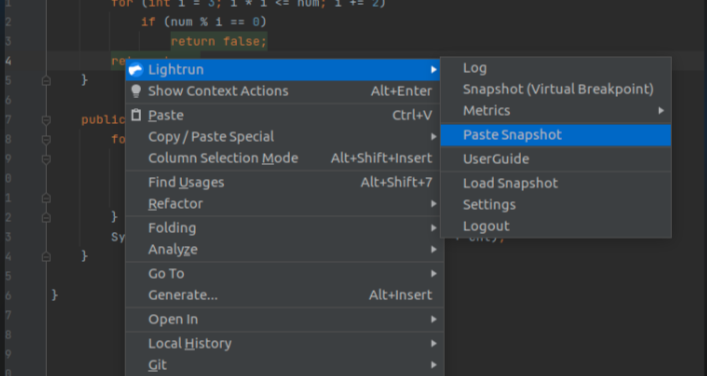
Right-click to open the context menu:
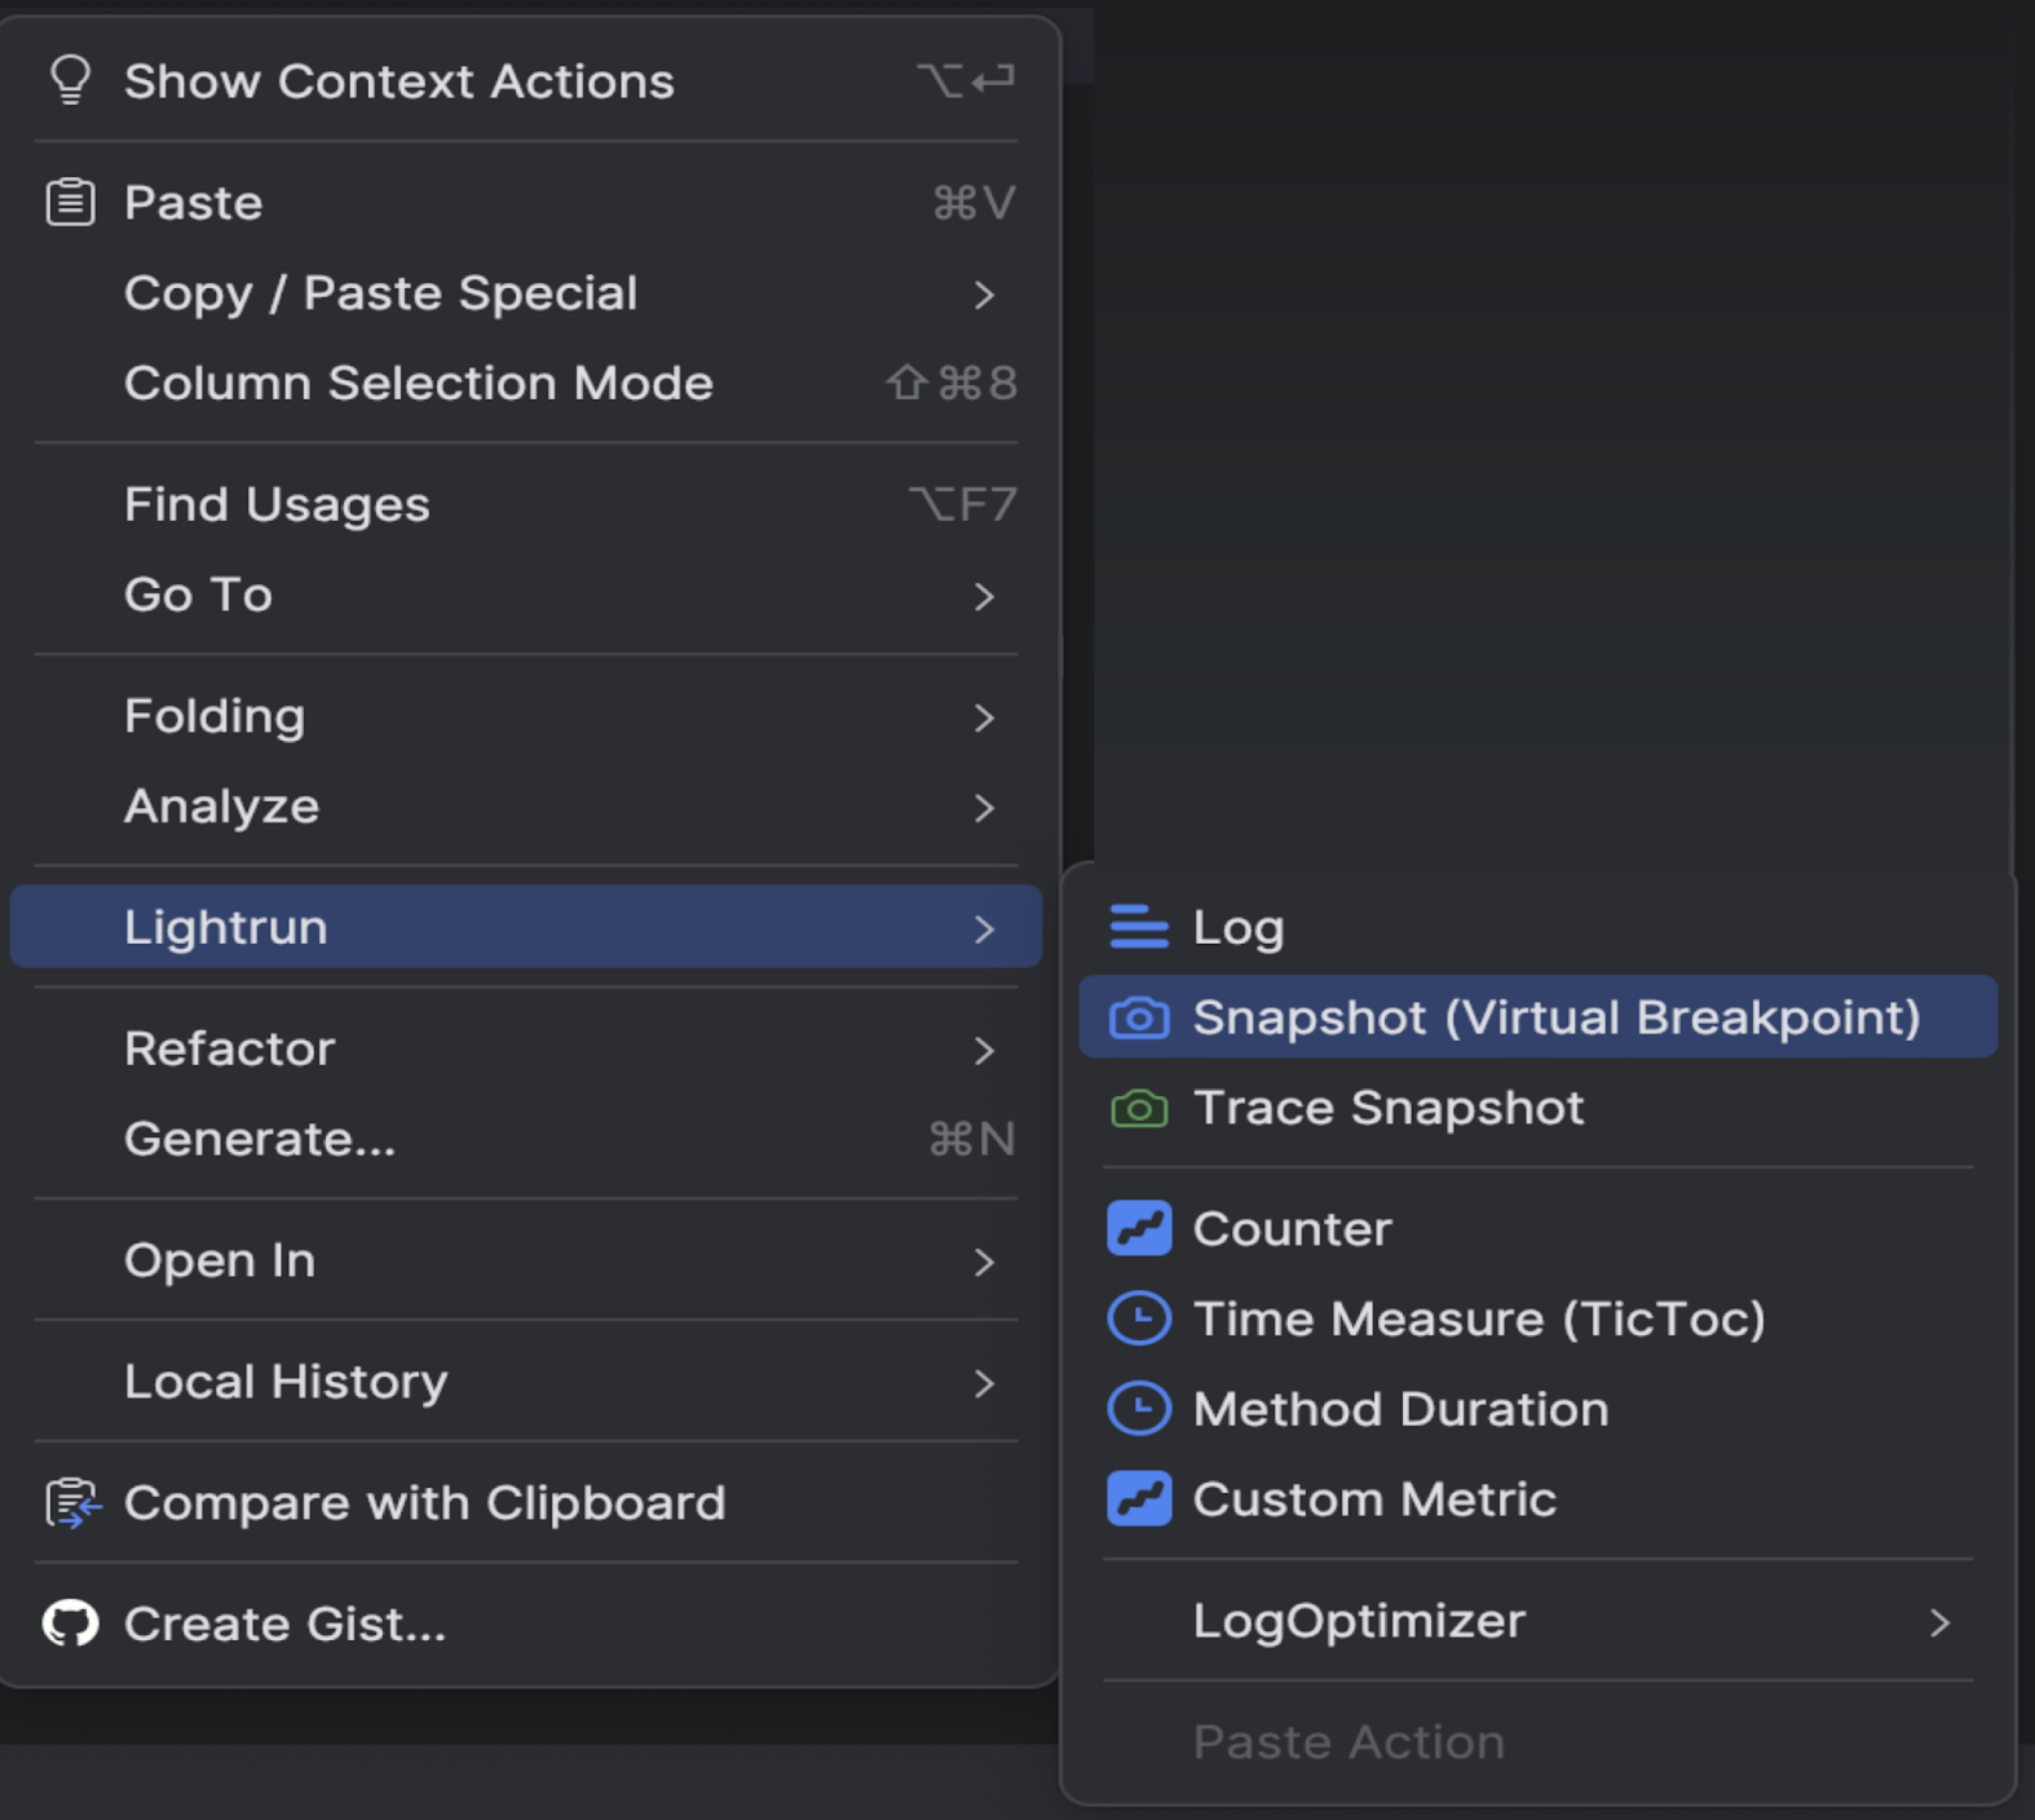
-
Select Snapshot (Virtual Breakpoint):
The Insert a Snapshot dialog opens.
Note from version 1.57, the
Snapshot Max Hit Countfield has changed toMax total hitsand the functionality has changed. Follow the instructions based on your Plugin version. -
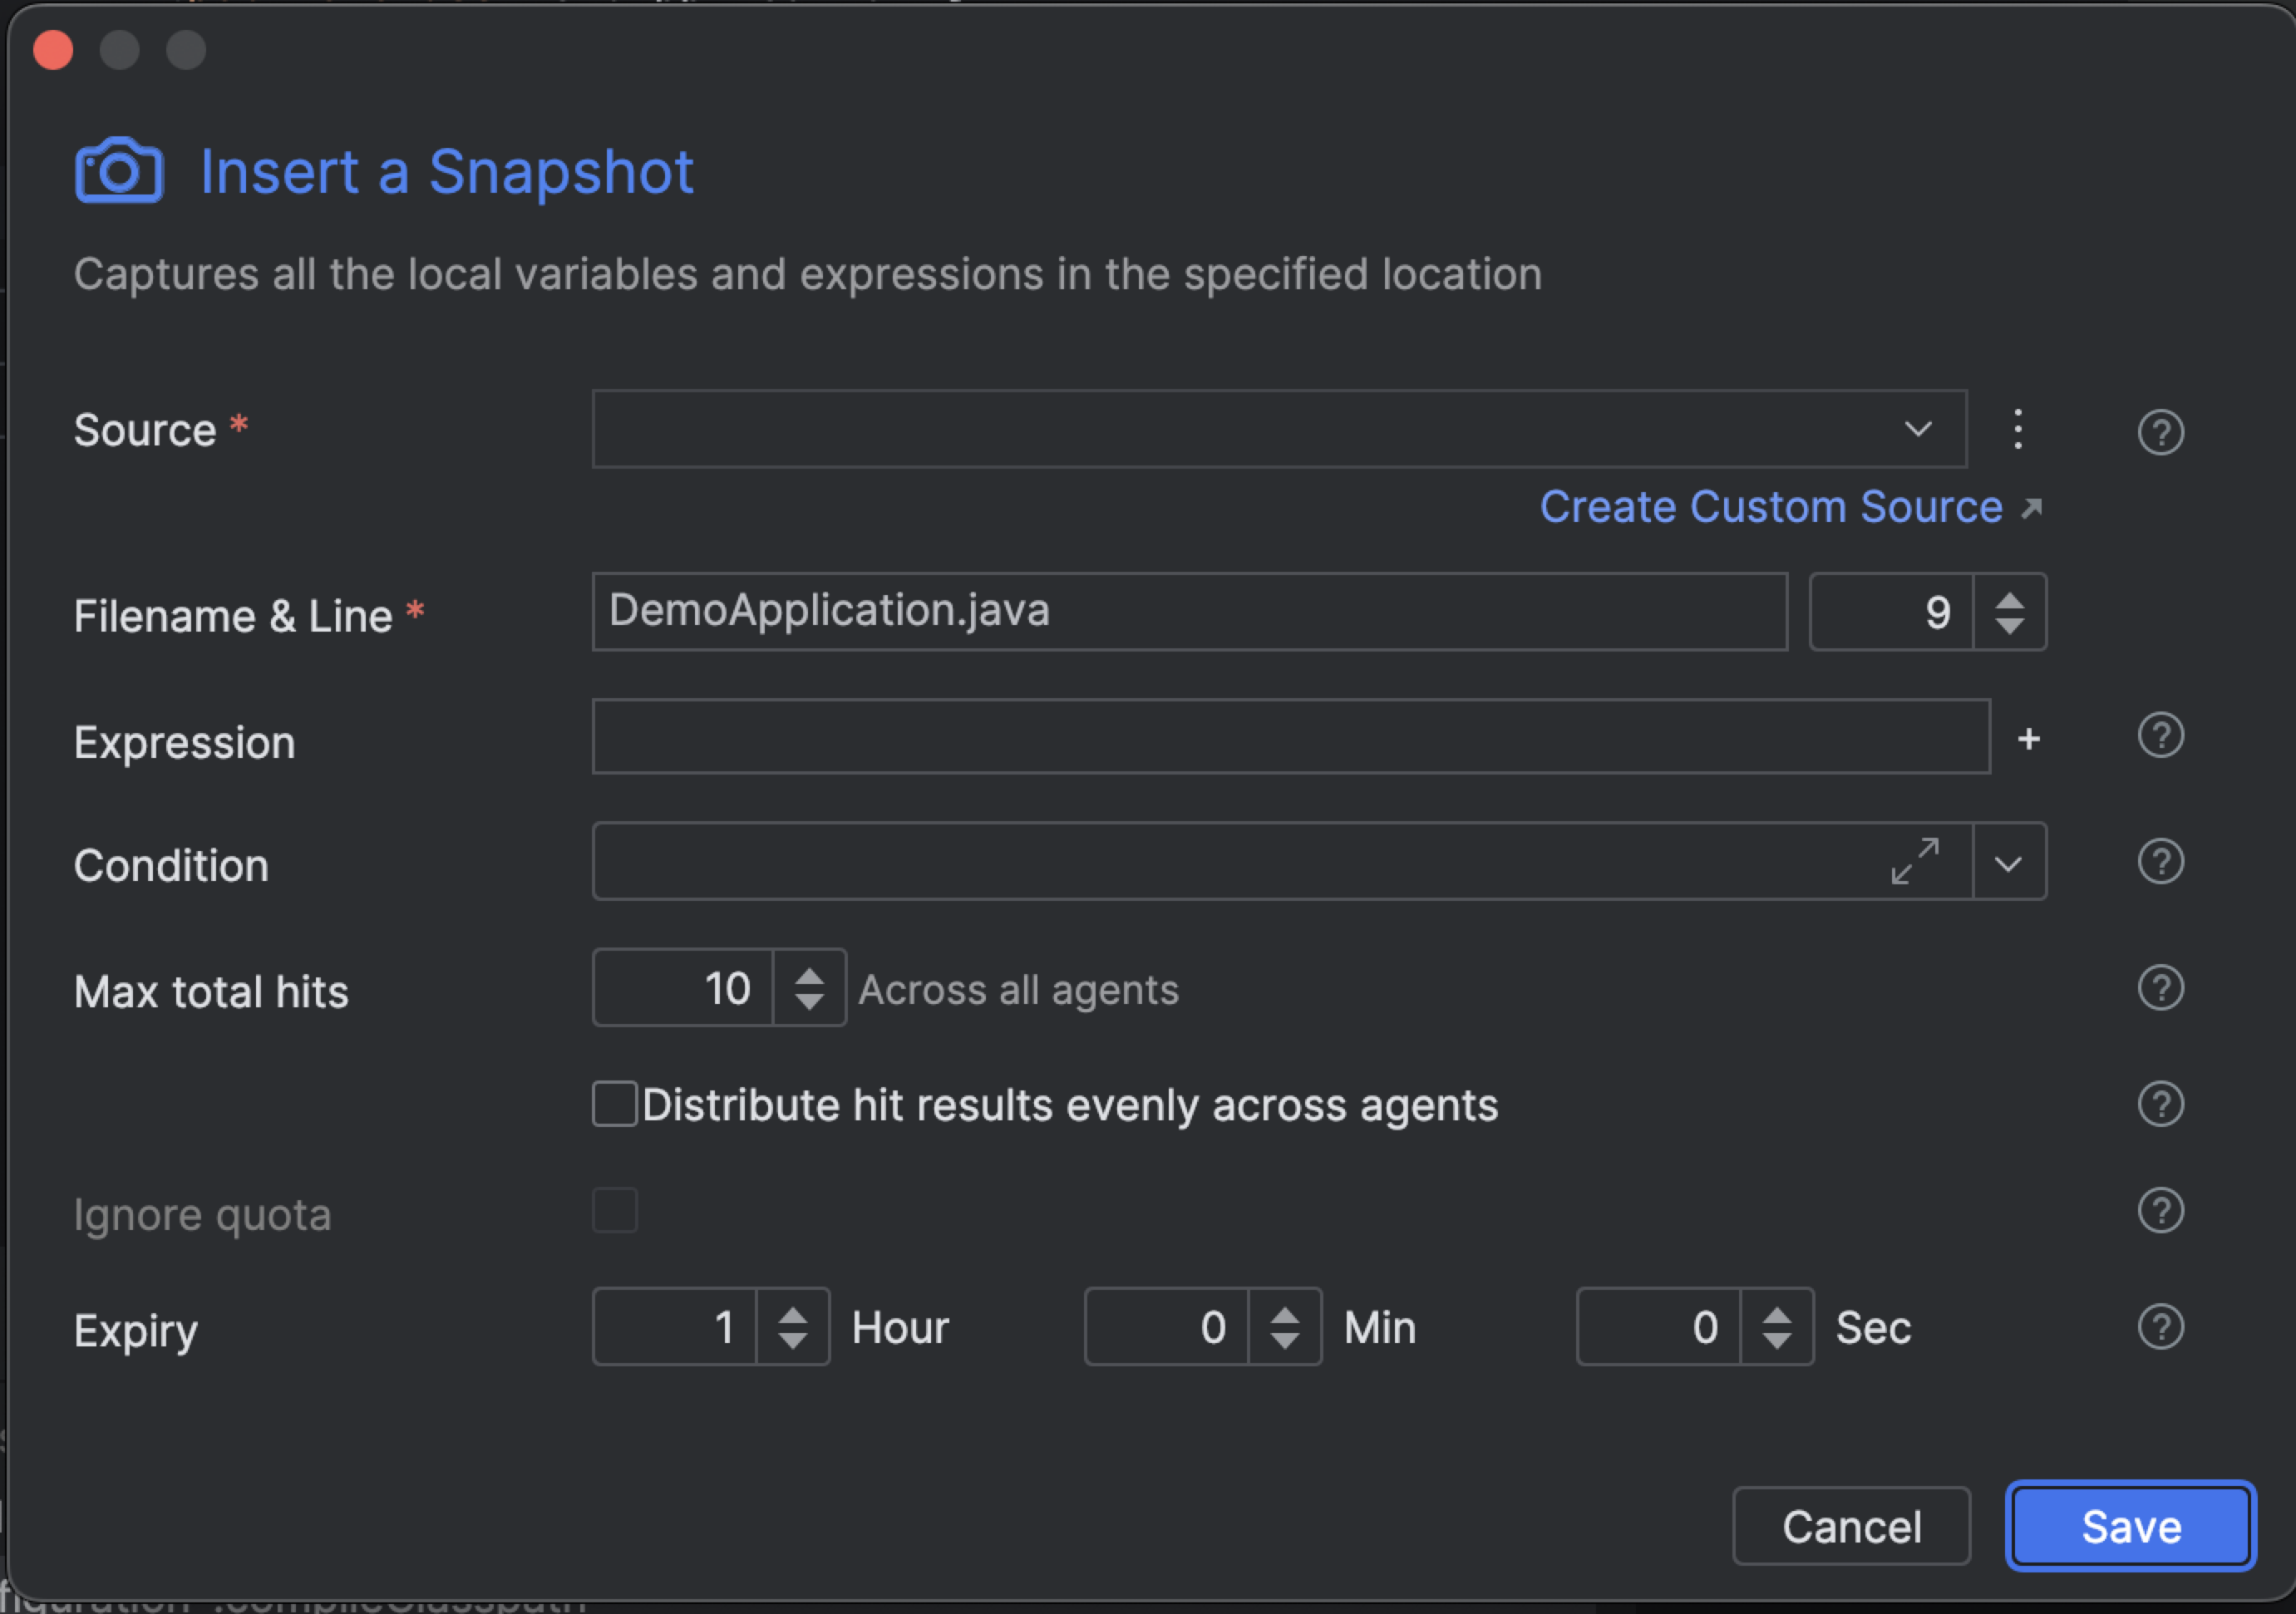
In the Insert a Snapshot dialog complete the fields, as follows:
-
From version 1.57
-
Up to and including version 1.56.
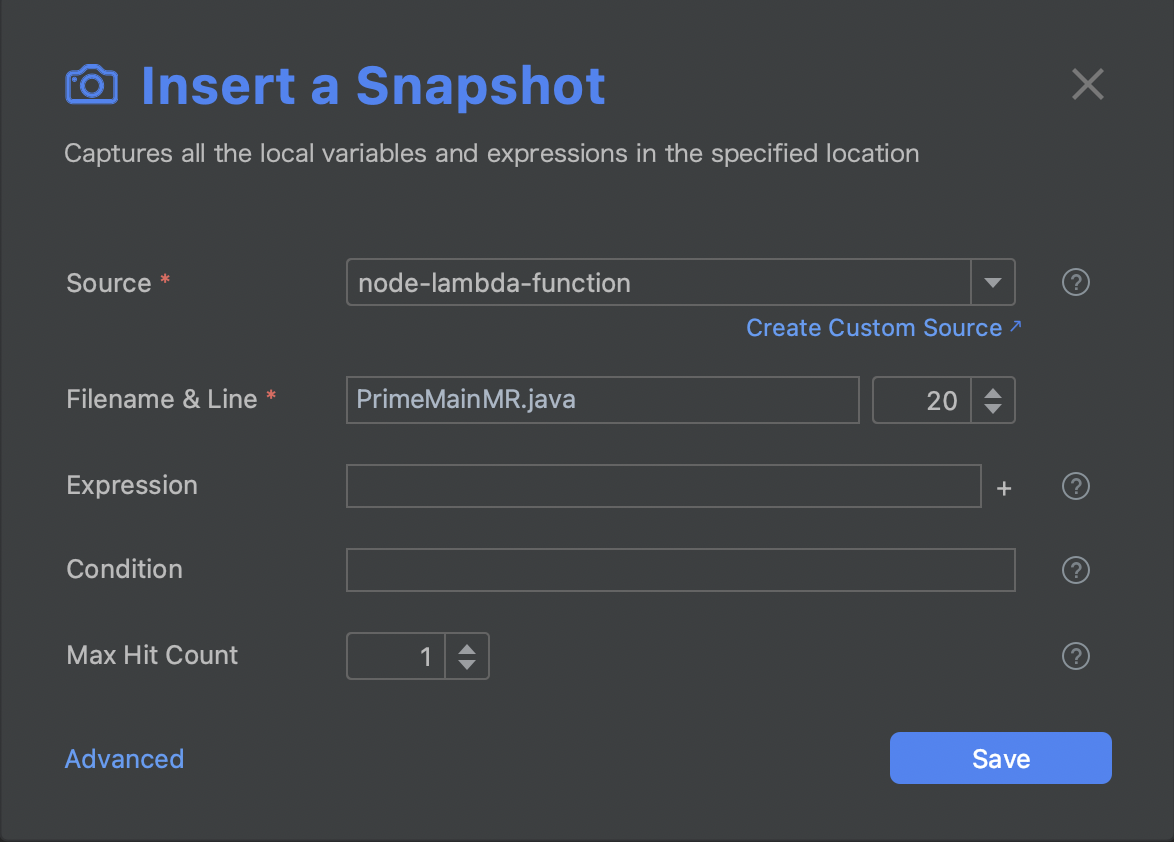
The following table describes the fields.
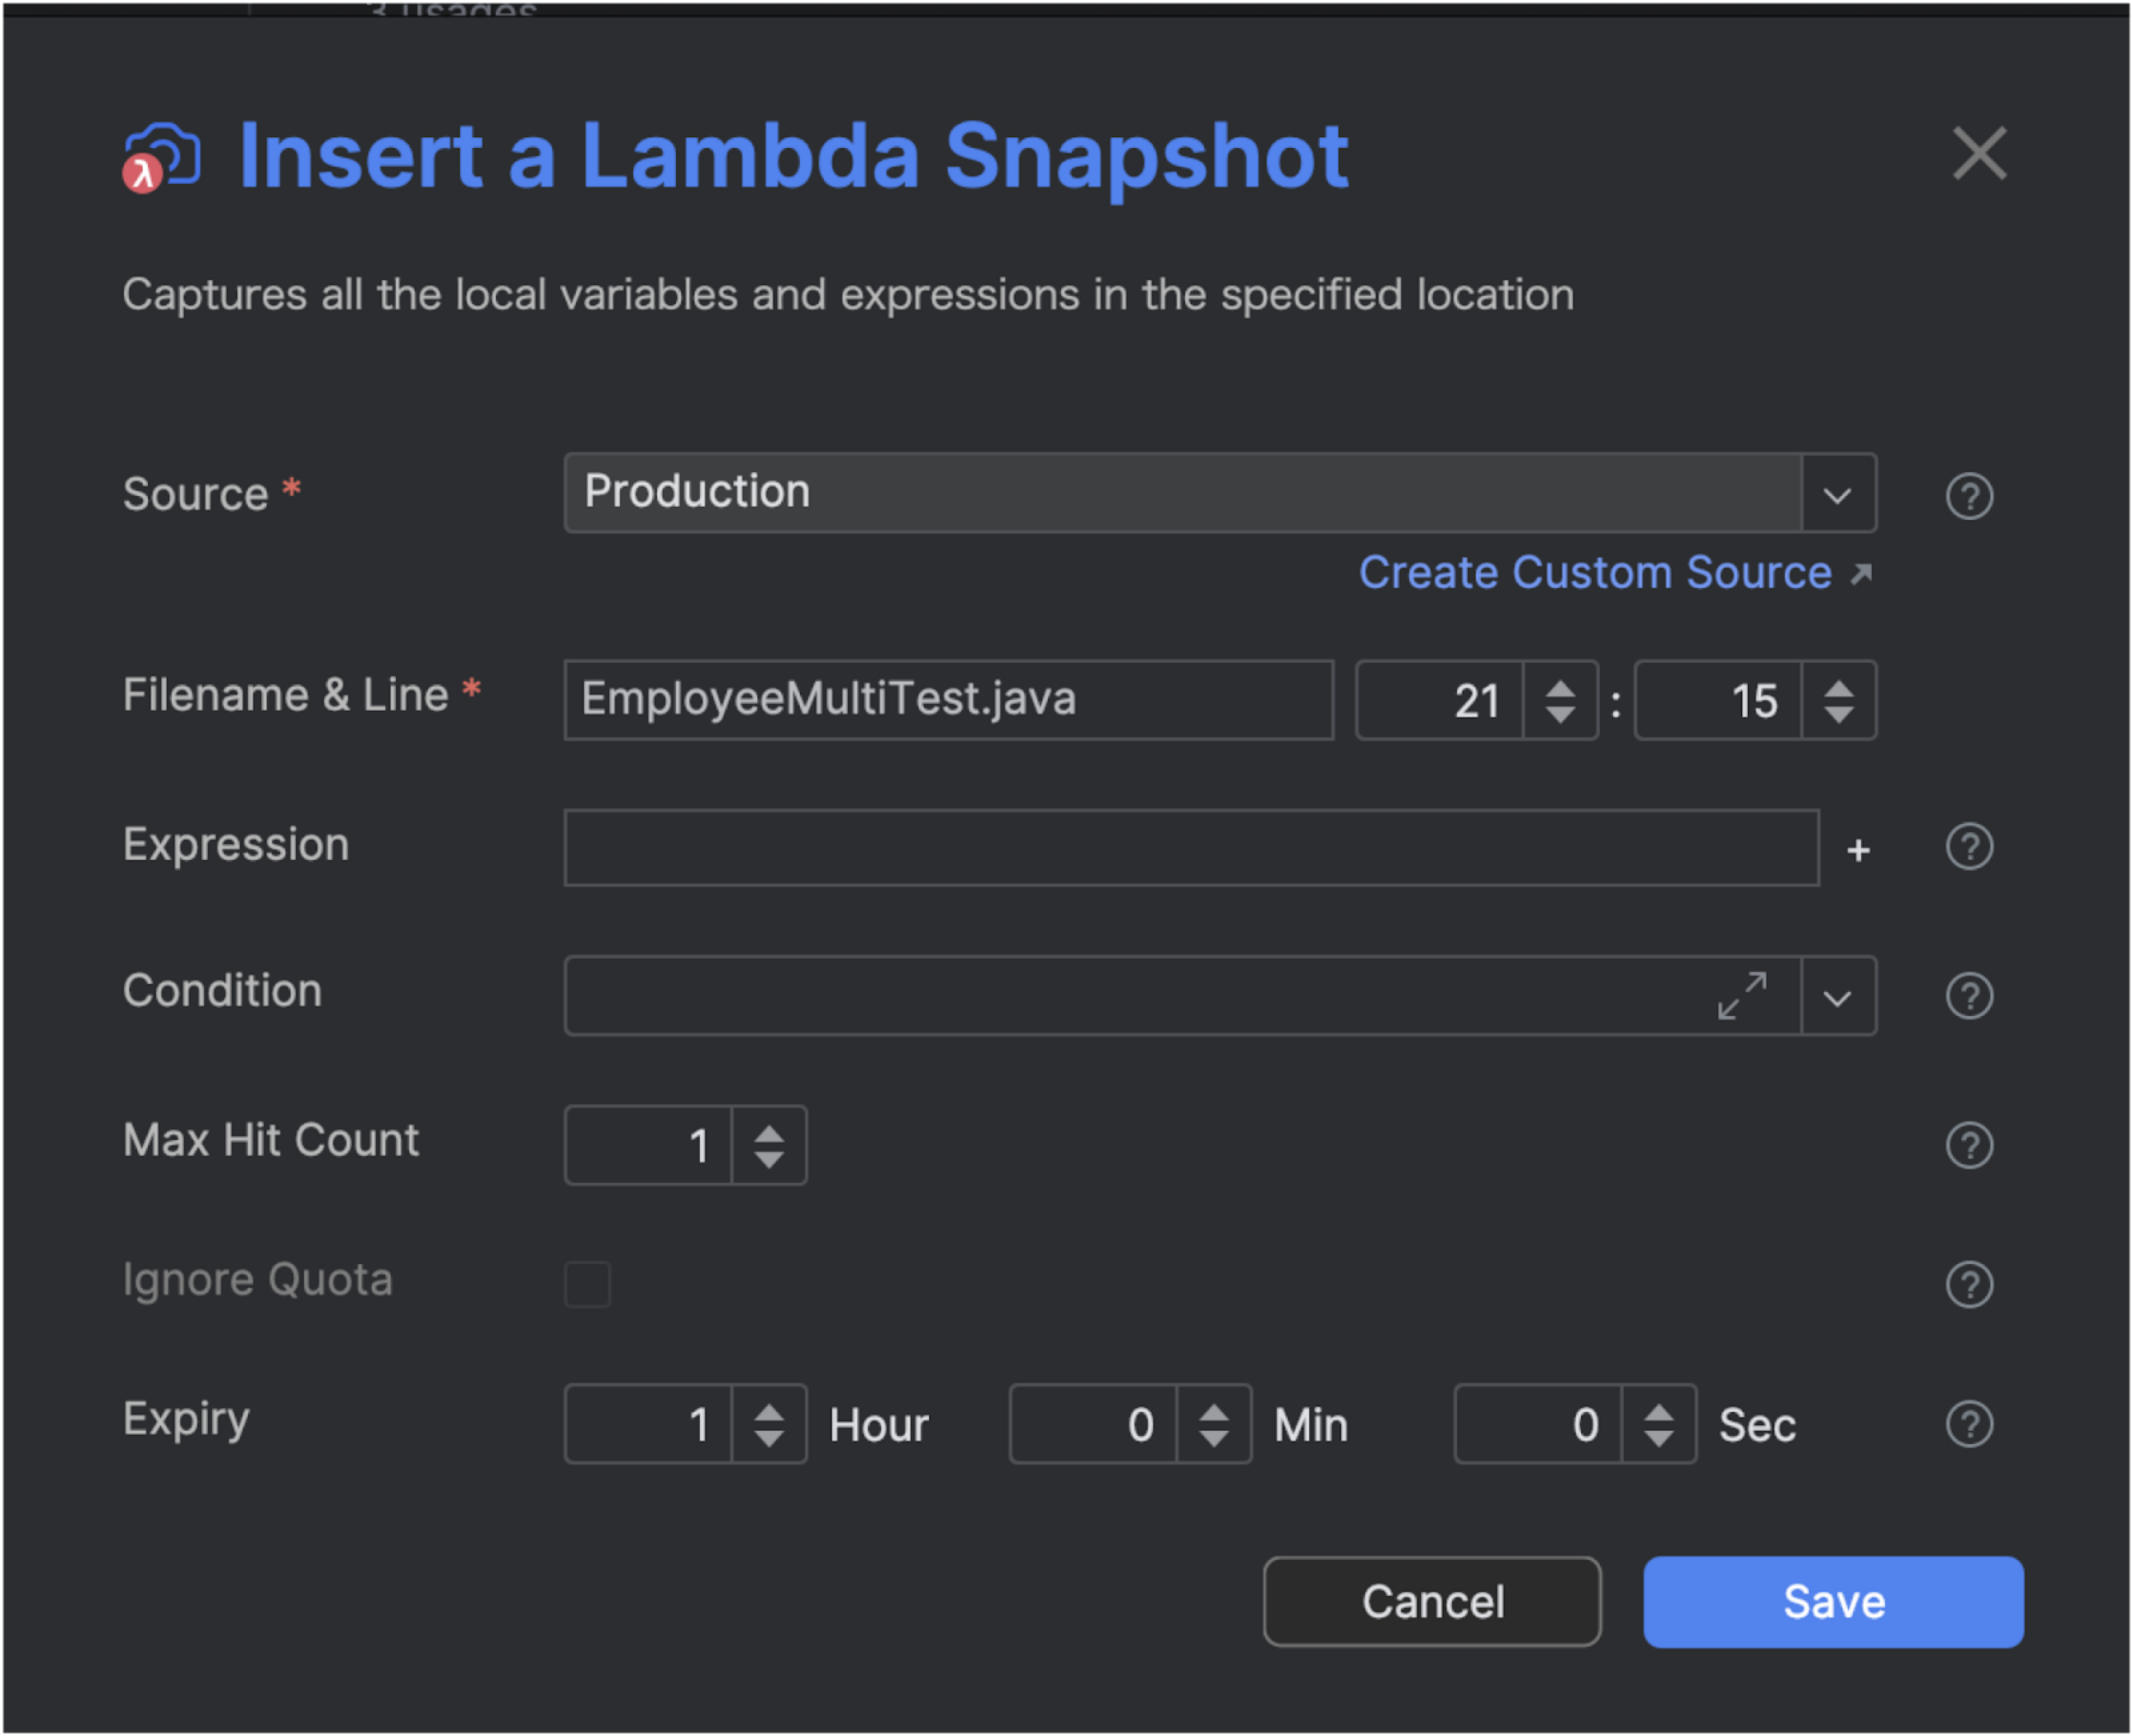
Field Description Source From the available options in the dropdown list, bind the action to a specific agent, tag, or custom source.
Click Create Custom Source to create a new custom source.Filename & Line The source code file and line of code into which you're inserting the snapshot. The default path is to the source code file from which you're currently working. Expression Variables or method results to be displayed in the snapshot stack trace. Click + to enter additional expressions. Condition The condition of an ifstatement, used to limit the execution of the action. For example, The conditionmyVar % 7 == 0limits the action (log, snapshot, metric) output so that it only prints for variables that are divisible by 7.Max Hit Count
[Up to and including version 1.56]The maximum number of times the snapshot should be taken during the lifetime of the action; default == 1. Max total hits
[From version 1.57]The maximum number of hit results across all agents (not per agent). By default, results are collected using a "first-come" approach: hits results are accepted in the order they arrive, regardless of which agent they come from. The default maximum is 10 hits. Distribute hit results evenly across agents
[From version 1.57]When the checkbox is selected, results are collected using a distributed approach, distributing the hit load more evenly across agents. This behaviour depends on the relationship between the max total hits value and the number of active agents:
- Max hits > agent count: Hits are divided as evenly as possible.
Example: max hits = 10, agent count = 5 → each agent contributes up to 2 hits.
- Max hits < agent count: Each agent can contribute up to 1 hit.
-
-
Click Advanced to configure the following additional fields:
Field Description Ignore quota The maximum number of times the snapshot should be taken during the lifetime of the action; default == 1. Expiry The time after which the action ceases to track code behavior and is automatically disabled; default = 1 hour. -
Click Save to add the snapshot.
A snapshot icon
 should appear next to the selected code line in your JetBrains code editor.
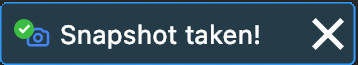
Once a snapshot hit has been captured, you will be notified directly in your IDE.
View snapshot data🔗
Once a snapshot hit has been captured, you can view the snapshot data directly in your IDE or in the Lightrun management portal in your browser. Click here for more information on how to view your snapshot data in the Lightrun management portal.
To view snapshot data in your IDE, click on the snapshot marker to open the Lightrun Snapshot window or click on Lightrun Snapshots in the bottom part of your IDE.
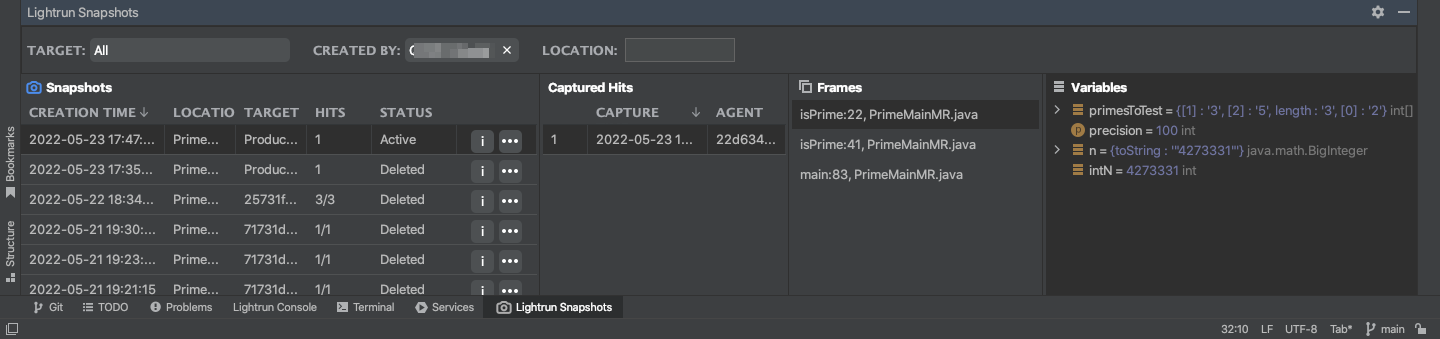
The Lightrun Snapshot tool window should appear similar to the following image.
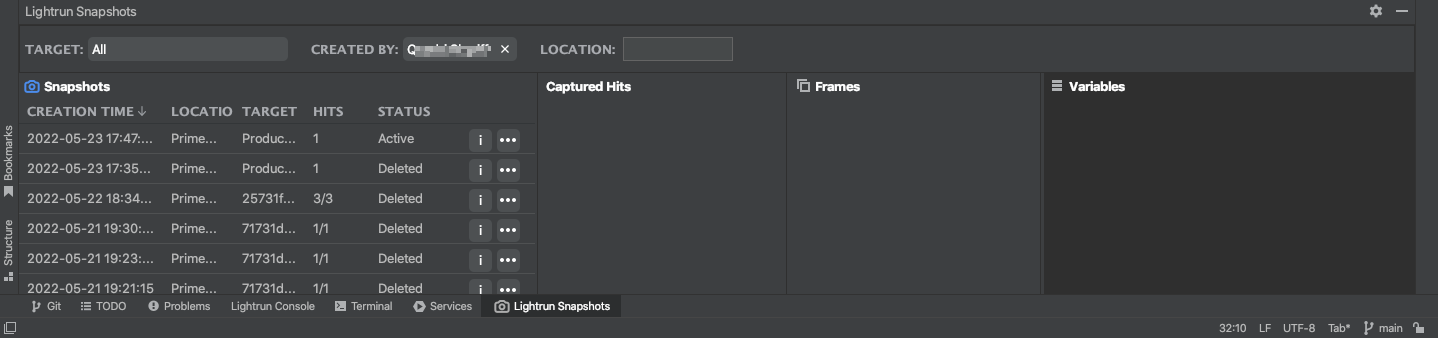
Click on a snapshot to populate the Captured Hits, Frames, and Variables section with its data.
See JetBrains plugin quick tour to learn more about the Lightrun Snapshot tool window.
Capture full and deeper snapshot values🔗
Note
Capture more for the Java agent is supported from version 1.78. For the Node.js agent in JetBrains IDEs, use Lightrun 1.83 or later.
When working with snapshots, variable values may be limited by size, object depth, or number of elements. Capture more lets you collect full or deeper data for a specific variable directly from the snapshot results, without manually creating watch expressions.
Supported scope
Capture more is supported in:
- JetBrains IDE plugin
- Java and Node.js agents
Capture more is available for variables from the latest frame only.
Capture more can be used for:
- Variables and object fields (including nested/inner objects)
- Arrays (including multi-dimensional arrays where applicable)
- Common collections: for example, Java
ListandMap, or JavaScriptMapand similar structures
Capture more does not apply to:
- Individual collection elements (for example, selecting
[99]or a specific map entry). Select the parent collection instead.
Capture more data for a variable
- Open the Lightrun Snapshot tool window in your IDE.
-
Under Captured Hits, select a snapshot hit.
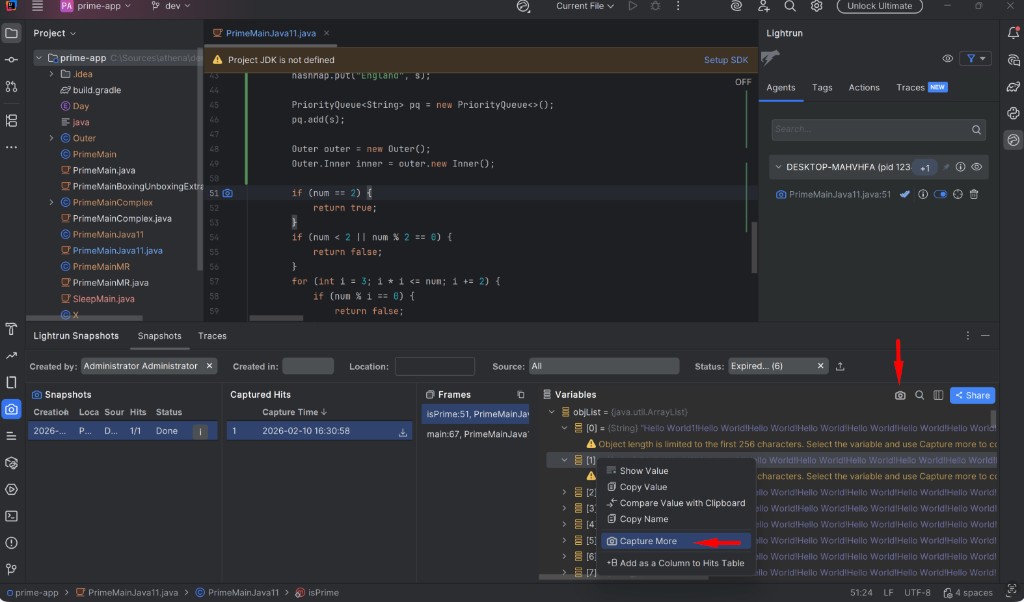
-
In the Variables section, select a variable.
- Click Capture more in the Variables panel toolbar, or right-click the variable and select Capture more.
A new snapshot is created automatically and becomes the active snapshot for future hits, capturing richer data for the selected variable. Previously captured snapshot data remains available in the IDE.
Edit and delete a snapshot🔗
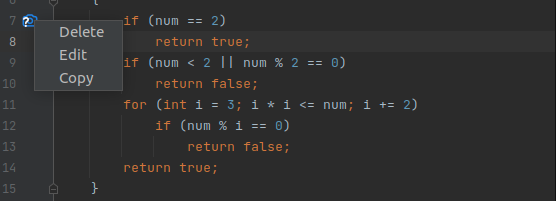
- Right-click on the snapshot marker on the snapshot code line.
- Click Delete to delete the snapshot.
- Click Edit to edit the snapshot configuration.
Copy and paste a Lightrun snapshot🔗
This procedure allows you to easily reuse existing snapshots in multiple locations within your code. Note that the snapshot is saved in the clipboard and can be pasted multiple times.
- Right-click on the snapshot marker on the snapshot code line that you would like to copy.
-
Click Copy to copy the snapshot settings.
-
Go to the line of your target source code at which you'd like to insert the copied snapshot, right-click and click Paste Snapshot.
Compare snapshot hit variable values in clipboard🔗
- Select the Snapshot tab in your JetBrains Lightrun plugin.
- Under Captured Hits, select a specific snapshot hit.
- Select a Frame and access the Variables tab.
-
Click the value of a variable, right-click, and select Copy Value.
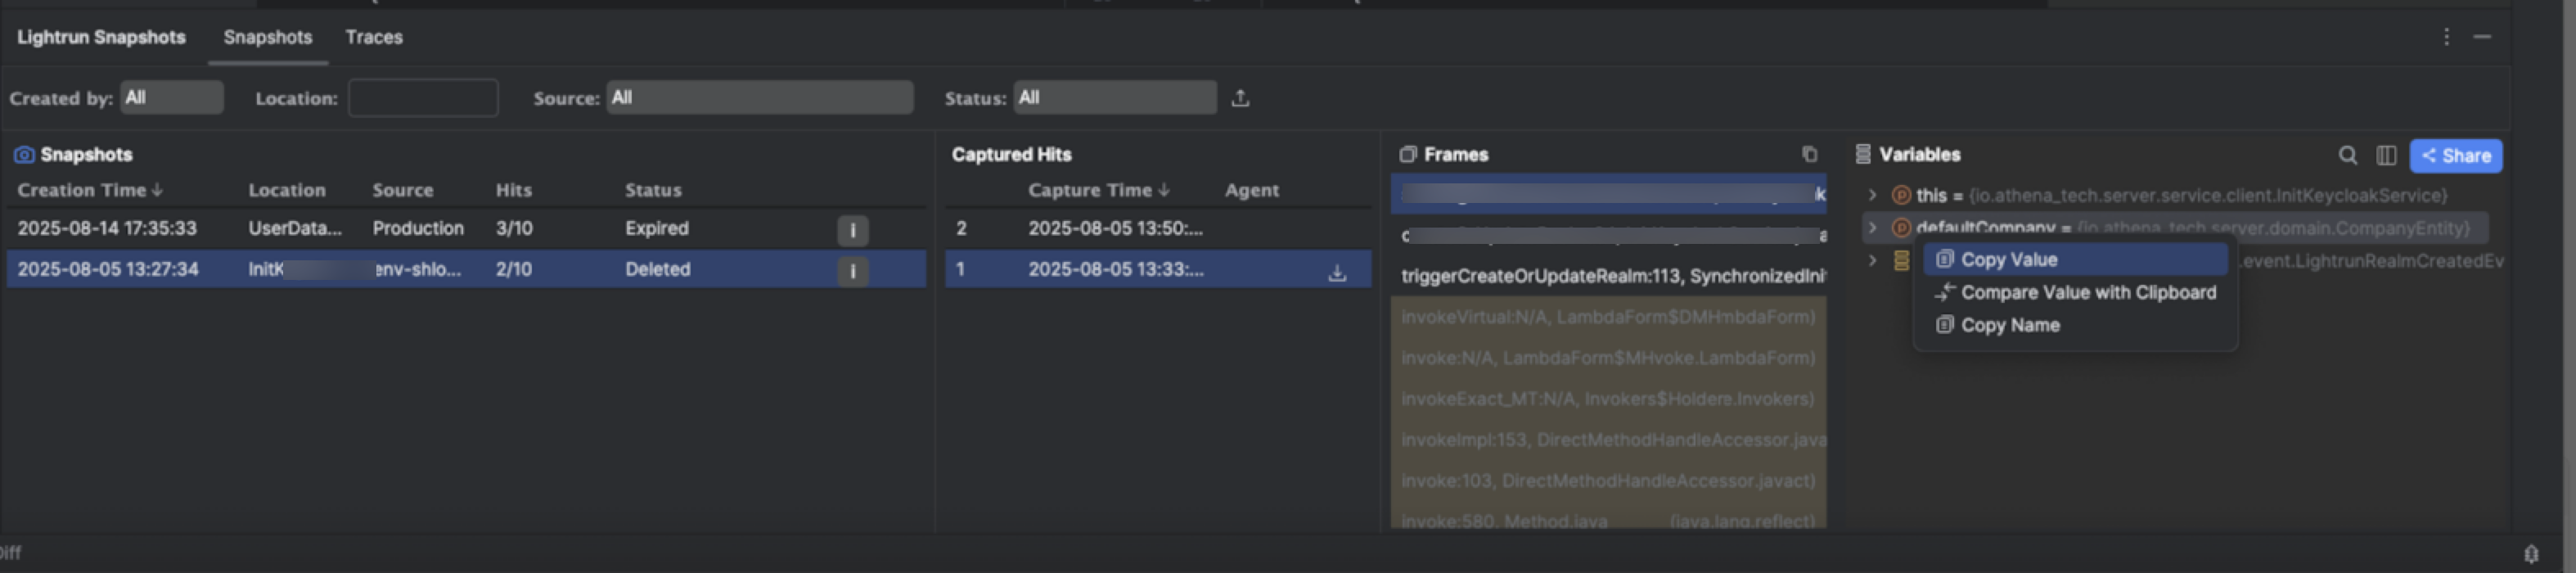
The Copy to Clipboard message appears in the IDE editor.
-
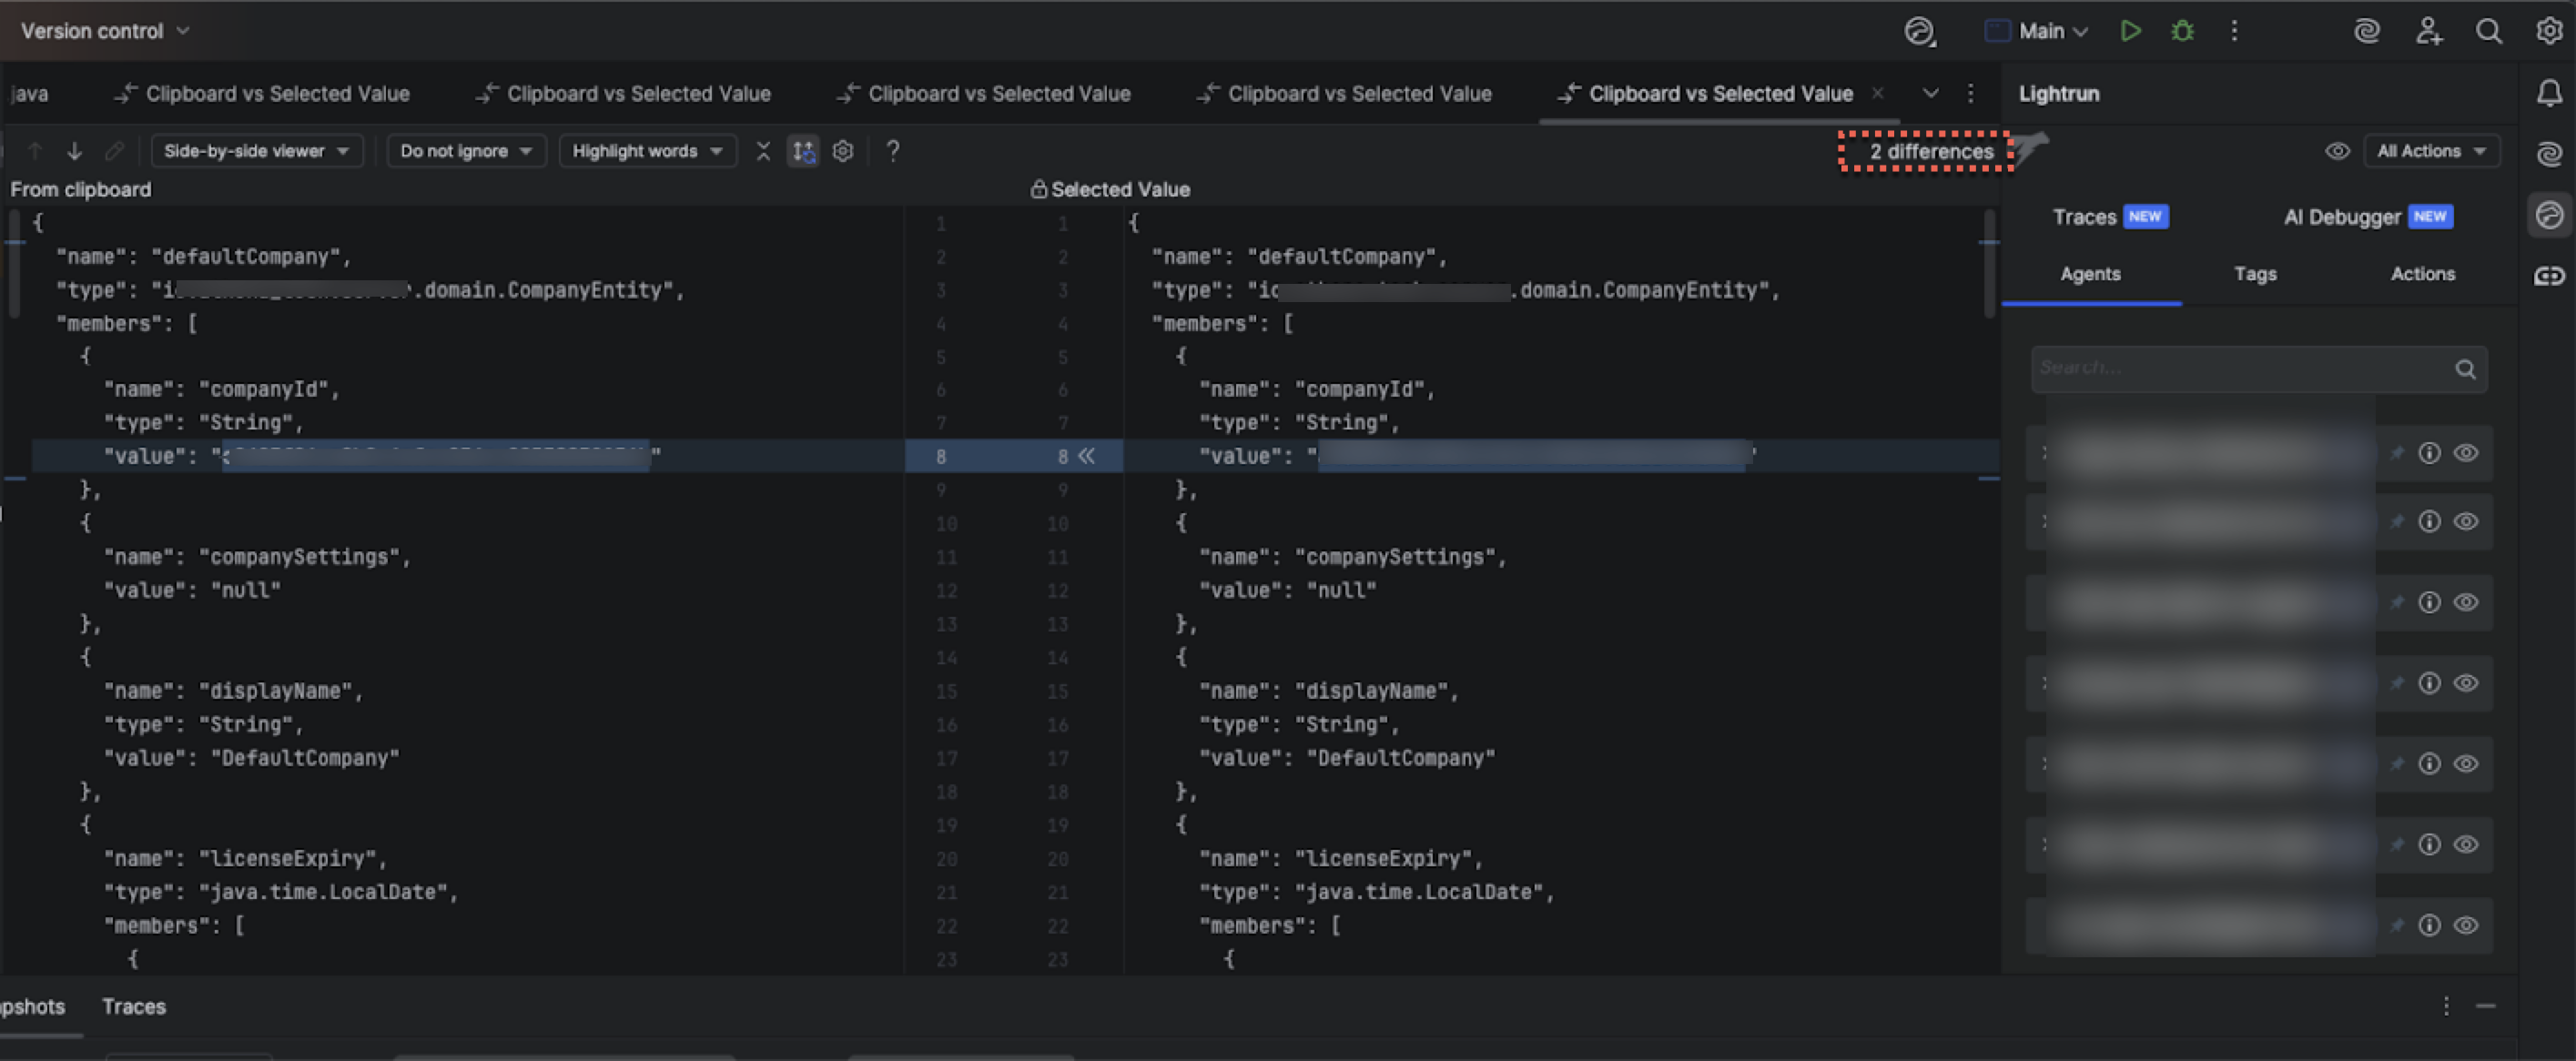
Select another variable value, right click, and select Compare Value with Clipboard.
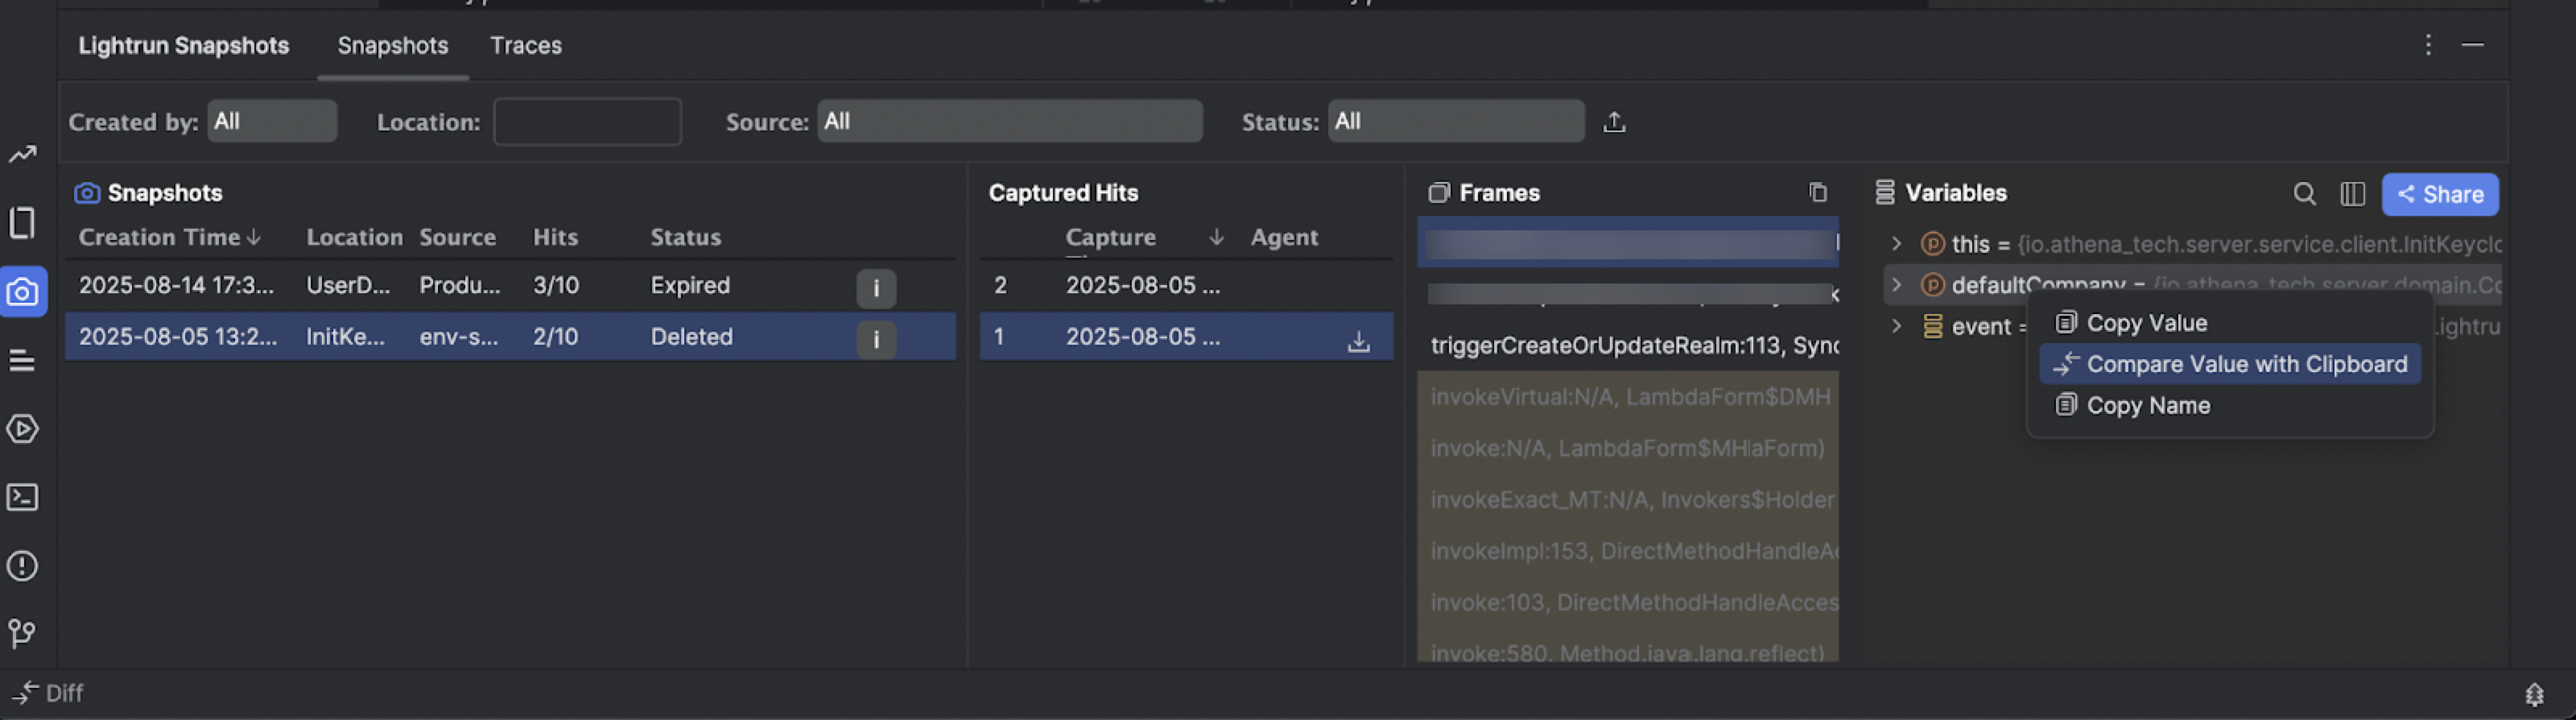
The Clipboard vs Selected value view opens with the hightlighted differences and the number of detected changes diplayed.
Compare cross snapshot-hit variables🔗
This feature is not supported with imported snapshots and complex objects.
The Compare Cross-Snapshot Hit Variables feature allows developers to examine differences in variable values across multiple snapshots captured at different points in time or execution contexts. This capability makes it easier to detect state inconsistencies, understand logic regressions, and verify the effect of code changes - all without rerunning the application.
When debugging complex systems, issues often arise due to unexpected changes in application state between executions or over time. By comparing hit variables across snapshots, developers can:
- Identify where a variable’s value diverged from expected behavior.
- Analyze how a change in one component affects dependent logic.
- Validate that a recent code change corrected (or did not affect) a specific state.
- Select the Snapshot tab in your JetBrains Lightrun plugin.
- Under Captured Hits, select a specific snapshot hit.
- Select a Frame and access the Variables tab.
-
Select a variable, right-click, and select Add as a Column to Hits Table.
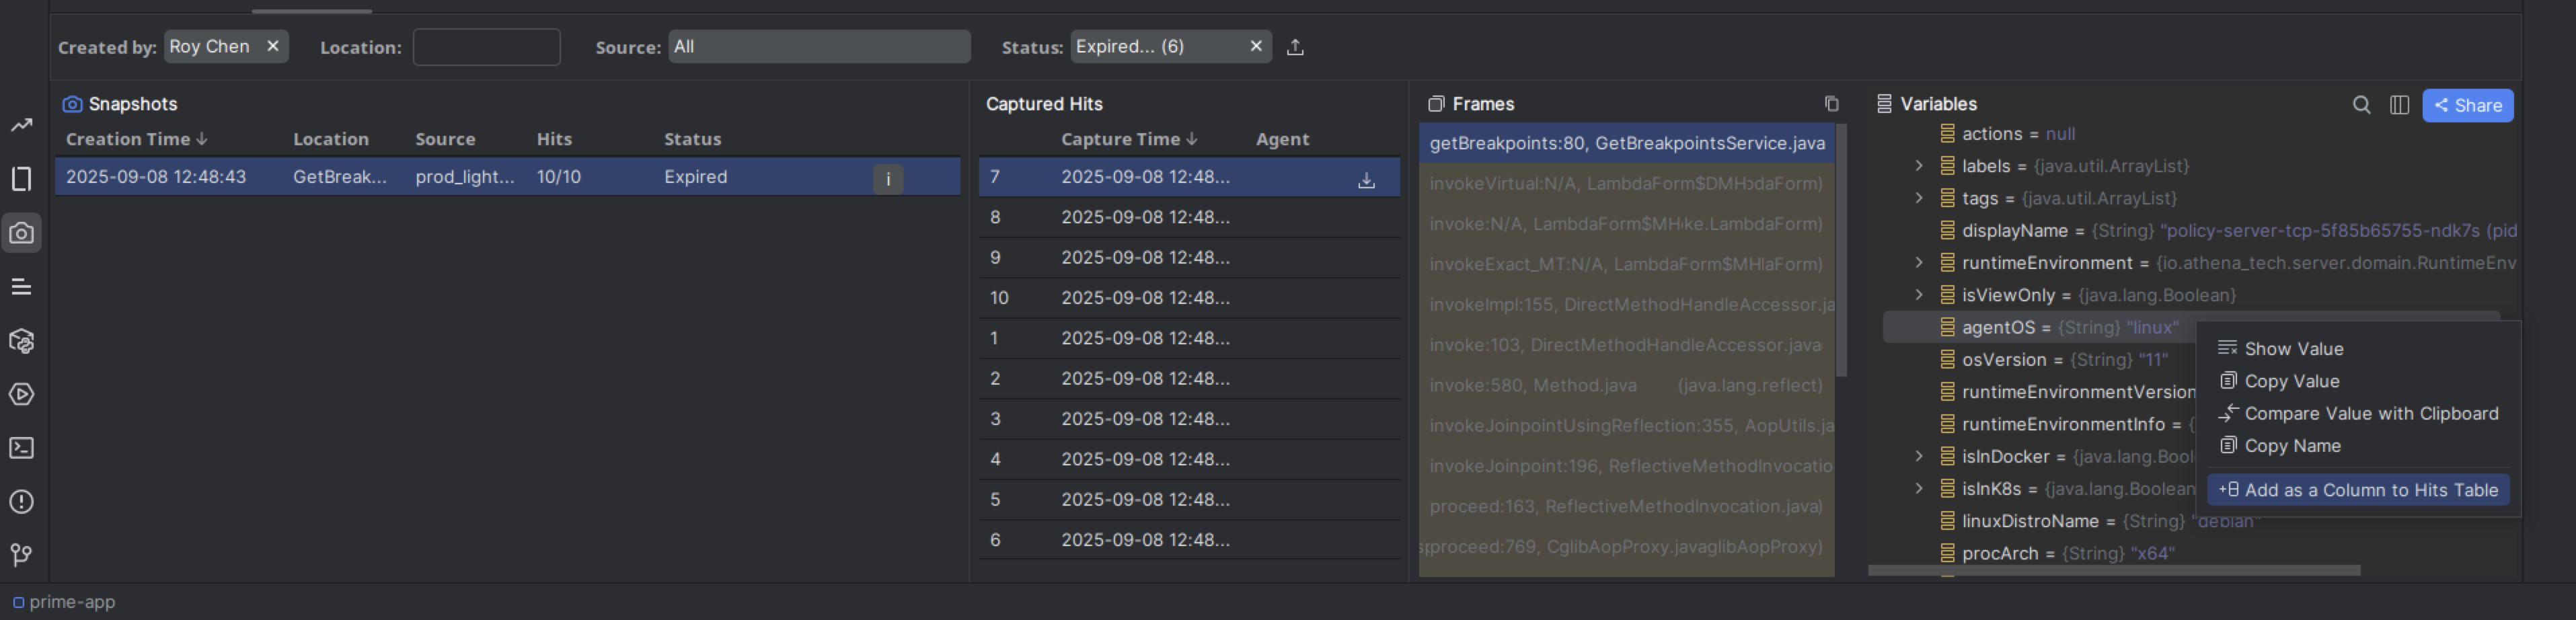
A dedicated column is added to the right of the Captured Hits column.

Export snapshot hit data🔗
After capturing a snapshot hit, you can export the data for your purposes, such as analysis, comparison, or collaboration. You can export data for all available snapshots in your system, or a single snapshot.
Starting from version 1.66, you can also export a concise JSON file that includes only frames and variables, making it easier to analyze the captured data.
Export snapshot full data🔗
- Select the Snapshot tab in your JetBrains Lightrun plugin.
-
Under Captured Hits, select a specific snapshot hit.
The Download icon appears to the right of the selected hit.
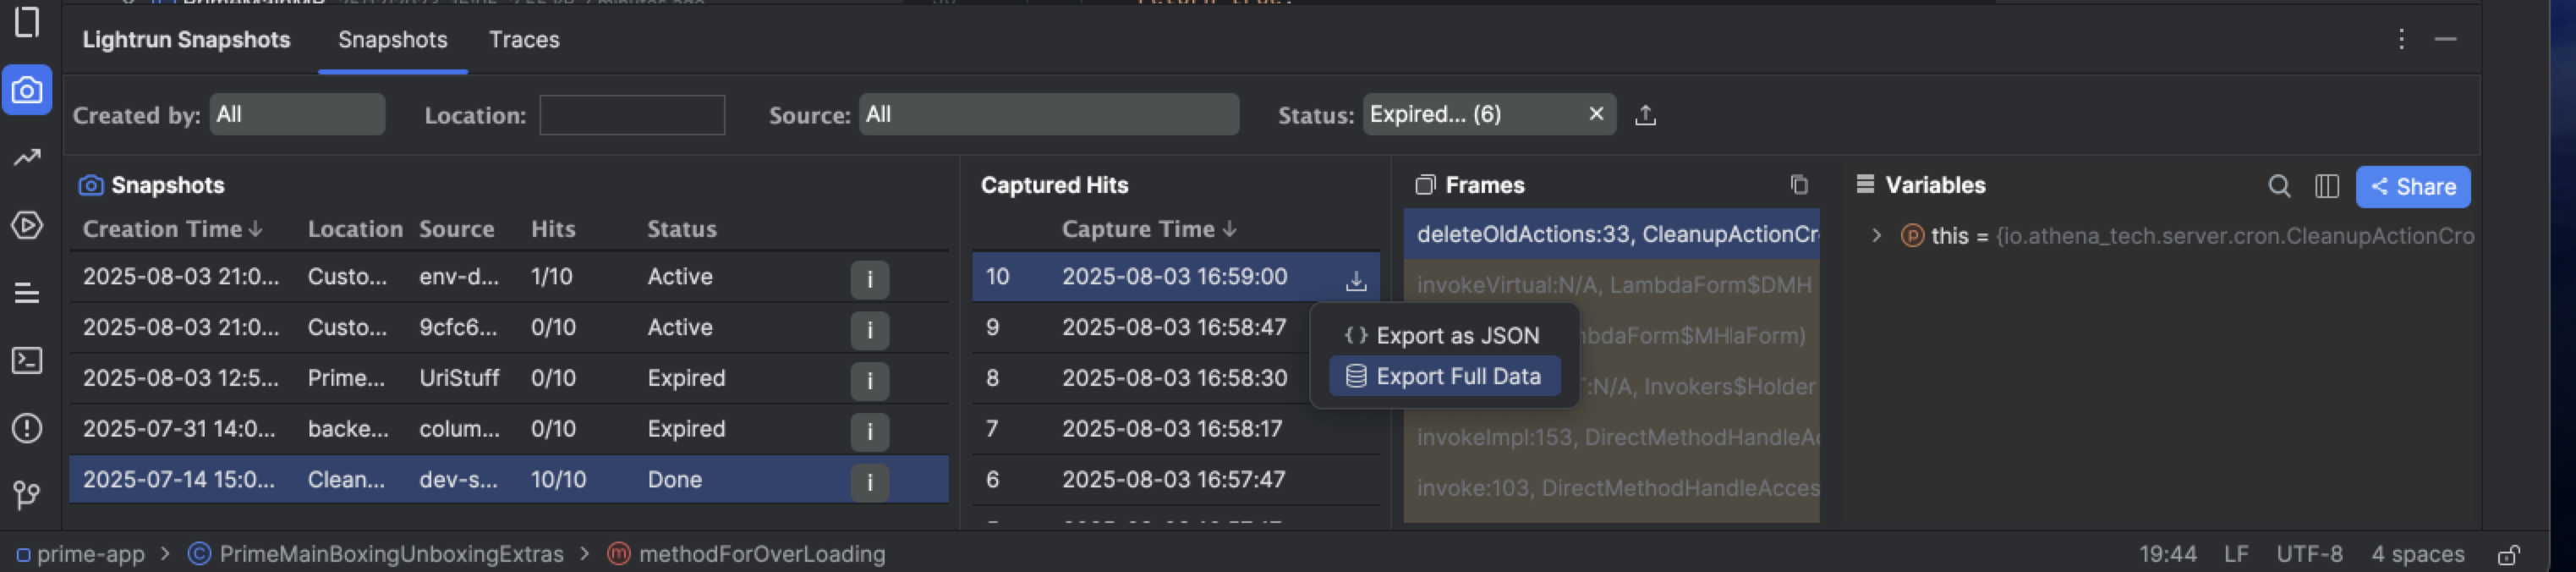
-
Select Export full data.
-
Select your preferred local folder and click Open to export the snapshots.
A file with the
.lrsnapshotextension will be saved to the selected location.
Export snapshot hit frames and variables data as JSON🔗
- Select the Snapshot tab in your JetBrains Lightrun plugin.
-
Under Captured Hits, select a specific snapshot hit.
The download icon appears to the right of the selected hit.
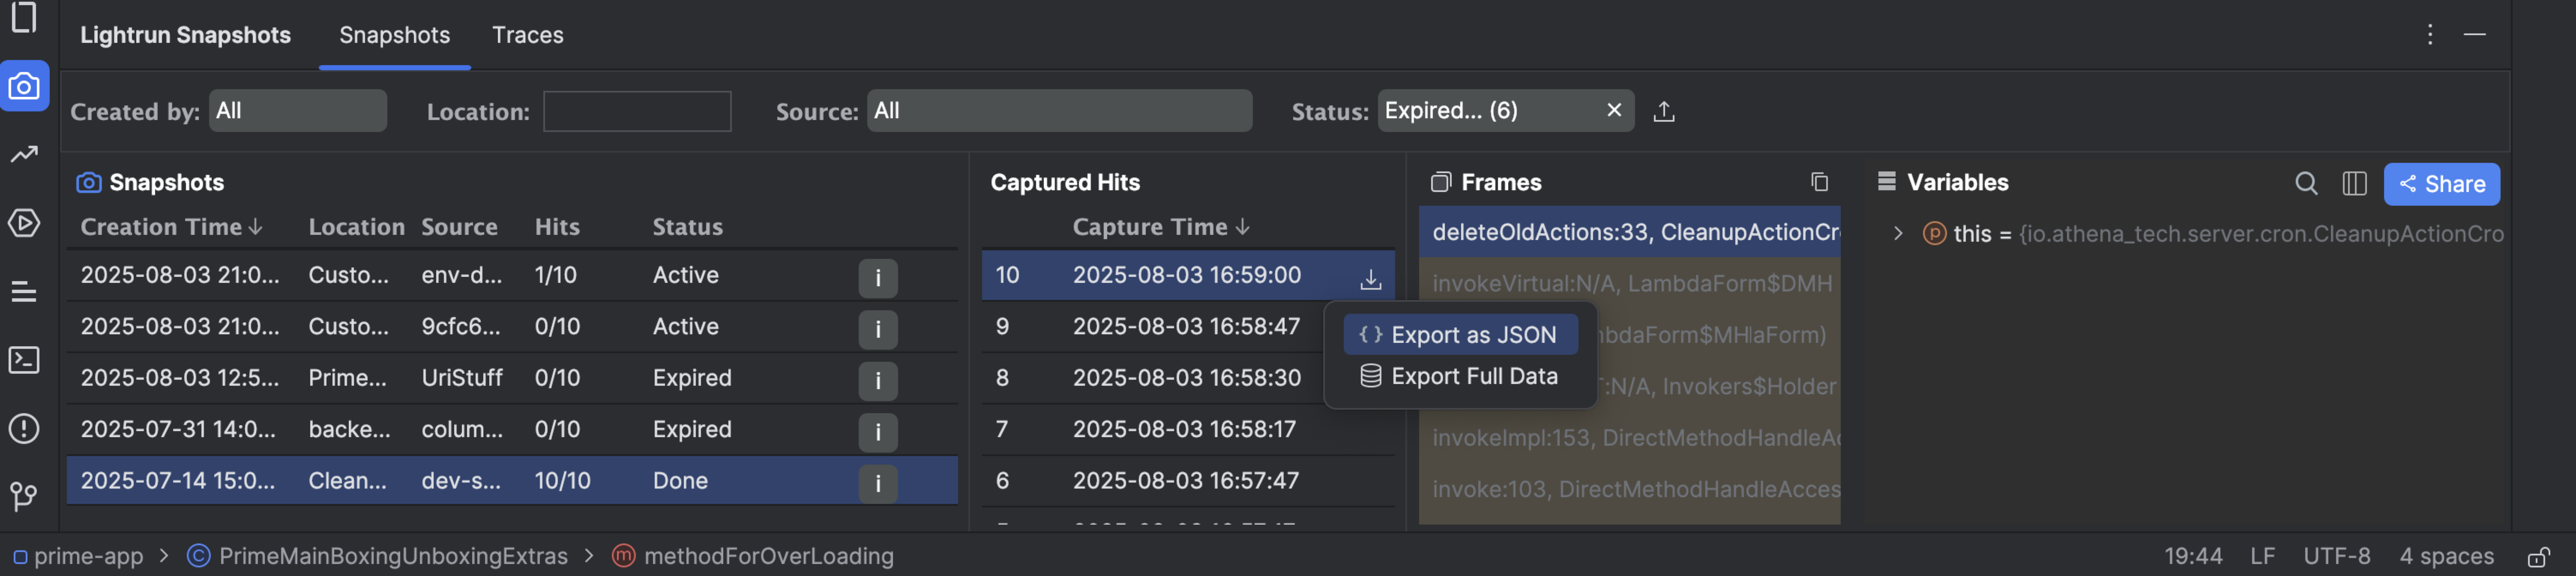
-
Select Export as JSON.
The Export Captured Hit dialog opens.
-
Select your preferred storage location and click Save to export the snapshot data.
The following is an annotated example of an exported snapshot hit JSON structure.
{
"actionHitInfo": {
    "hitId": "<unique ID of this snapshot hit>",
    "agentId": "<ID of the Lightrun agent that captured the snapshot>",
    "actionId": "<ID of the snapshot action>",
    "capturedAt": "<ISO timestamp of when the snapshot was taken>"
},
"frames": [
    {
    "frameIndex": <position of this frame in the call stack>,
    "file": "<path to the source file>",
    "line": <line number where the snapshot was triggered>,
    "method": "<fully qualified method name>",
    "arguments": [
        {
        "name": "<name of the argument or object>",
        "type": "<fully qualified class name>",
        "members": [
            {
            "name": "<field or property name>",
            "type": "<data type of the field>",
            "value": "<captured value at runtime>",
            "members": [
                // nested fields if the value is an object
            ]
            }
        ]
        }
    ]
    }
]
}
Upload snapshot hit data🔗
Upload snapshot data when you receive snapshot files from a colleague or want to reuse previously captured snapshots in your IDE.
- Select the Lightrun Snapshots > Snapshots tab in your JetBrains Lightrun plugin.
-
Click the Load Snapshot Upload icon.
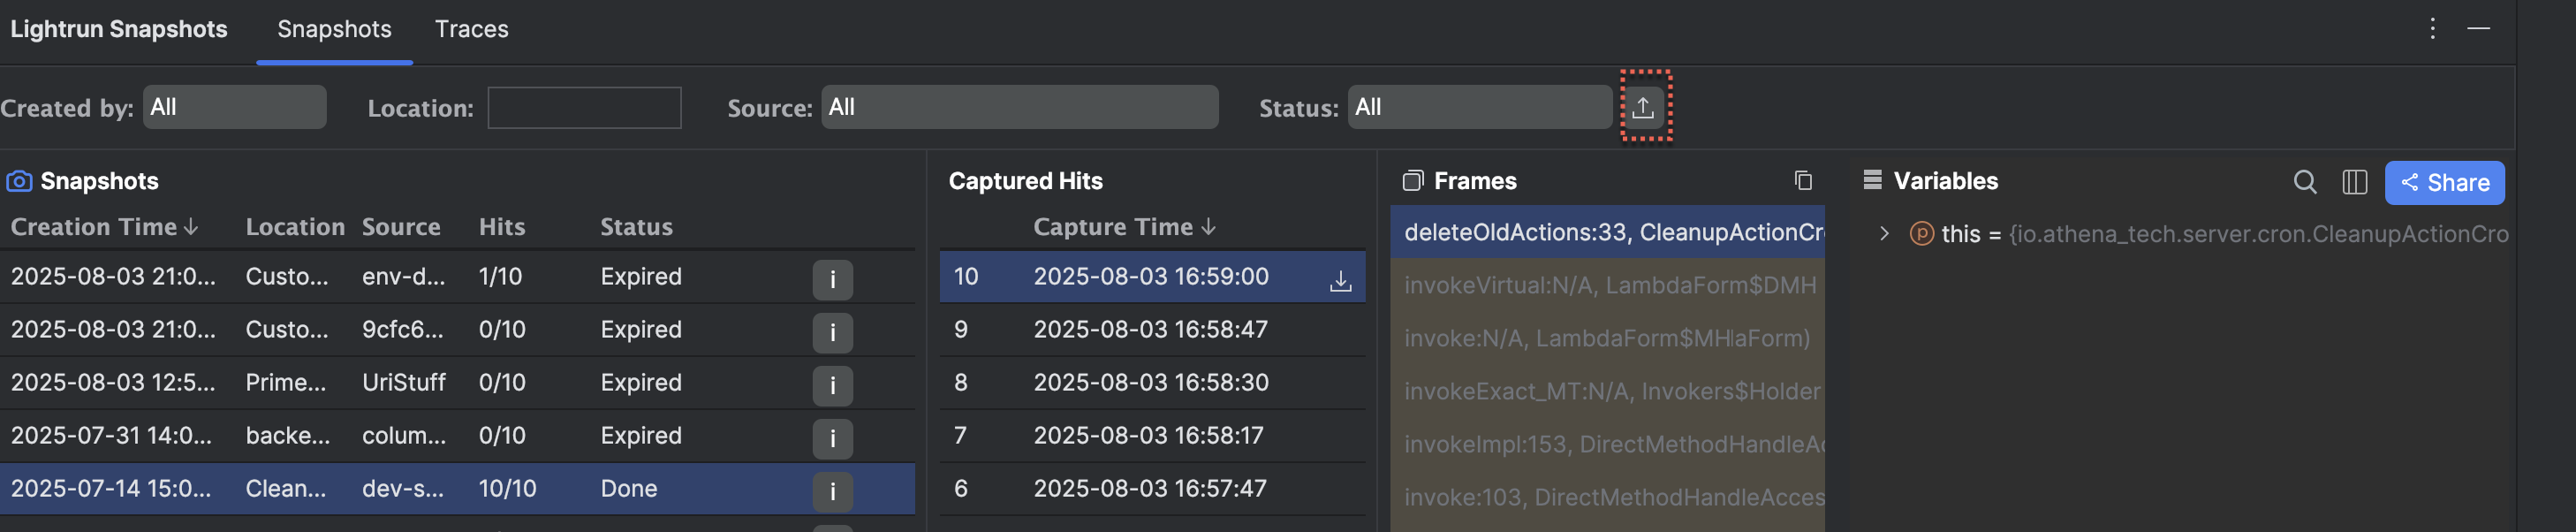
The file explorer window opens.
-
Select the required snapshot file with the
.lrsnapshotextension located on your local drive and click Open to import the snapshots.The snapshot data is uploaded to the Snapshots tab.
Debug Java lambda expressions in single-line code with Lightrun Snapshots🔗
Note
Lightrun Lambda Snapshots are supported from version 1.48.1.
A single line of code may contain multiple points of interest for debugging, such as Lambda expressions in Java streams. Lightrun supports placing snapshots directly within Lambda expressions that are part of a single line of code (often referred to as "Java one-liners"). Typically, Lightrun snapshots are placed at the beginning of a line to capture the application's state before the line of code executes.
Capture the application's state during execution example🔗
The following code example demonstrates the use of multiple Lambda expressions in a single line of code:
List<String> names = Arrays.asList("Alice", "Bob", "Charlie", "David");

List<String> filteredNames = names.stream().filter(name -> name.startsWith("A")).map(name -> name.toUpperCase()).collect(Collectors.toList());
- In the
.filterlambda: Capture the value ofnameto verify which names are being evaluated and filtered out. - In the
.maplambda: Capture the transformed value ofnameto ensure the uppercase conversion is functioning as expected.
When adding a snapshot, Lightrun automatically detects lambda expressions on the selected line and offers options to place the snapshot either on the entire line or directly next to the detected lambda expressions. The dialog title confirms that a lambda snapshot has been selected. All operations—including adding, viewing, editing, and deleting—work the same for lambda snapshots as they do for line-based snapshots.
To add a lambda Snapshot🔗
When working with lambda snapshots, the dialog titles indicate you are working on a Lambda snapshot. All operations—including adding, viewing, editing, and deleting—work the same for lambda snapshots as they do for line-based snapshots. For more information, refer to the relevant sections above.
-
Navigate to the line of your source code containing the lambda expression where you'd like to insert the snapshot, and position the snapshot next to it.
-
Right-click to open the context menu.
-
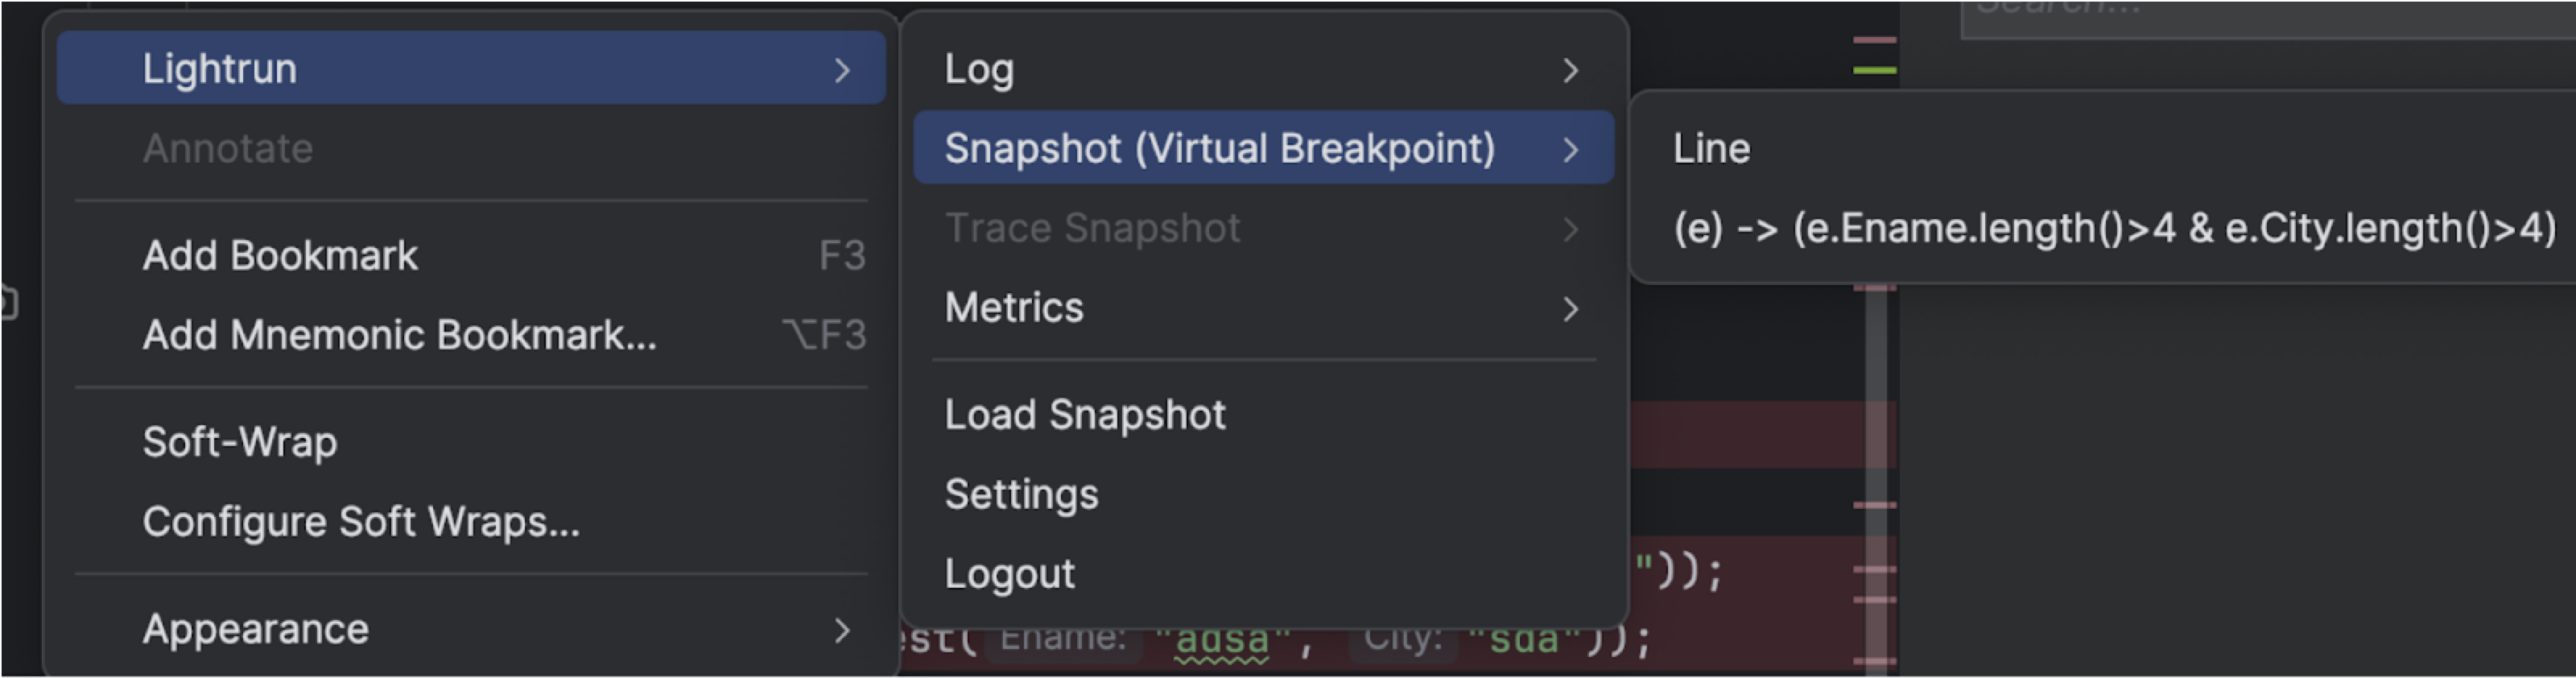
Select Snapshot (Virtual Breakpoint).
The line and the lambdas detected within it are listed.
-
From the list, select a lambda expression.
The Insert a Lambda Snapshot dialog opens.
-
In the Insert a Lambda Snapshot dialog, complete the fields (identical to line snapshots).
-
Click Save.
The lambda snapshot is added next to the selected code line and is added to the Actions tab, alongside line snapshots.
Lambda Snapshots in action🔗
The following tutorial demonstrates how to add a lambda snapshot. For a line containing the lambda expression (e) -> (e.Ename.length() > 4 && e.City.length() > 4), the lambda expression is automatically detected.
