Work with Lightrun Dynamic Logs in the JetBrains IDE🔗
Prerequisites
To use the plugin, make sure you have:
- Installed the plugin in your local IntelliJ instance.
- Authenticated IntelliJ with your Lightrun account.
- Attached at least one agent to your app.
- Opened the source code file for the running application from the IDE.
Add logs🔗
To insert a Dynamic Log into your code🔗
Note
Ensure that the default log message is valid and does not reference undefined variables, as this can cause runtime errors and a poor first-time experience. To evaluate expressions in log messages, wrap them in curly brackets (e.g., 2 + 3 = {2+3}).
- Go to the line in your application source code where you'd like to insert the log. Make sure to use the source code version currently deployed to production.
- Right-click to open the IntelliJ context menu.
-
From the Lightrun context menu, select Log.
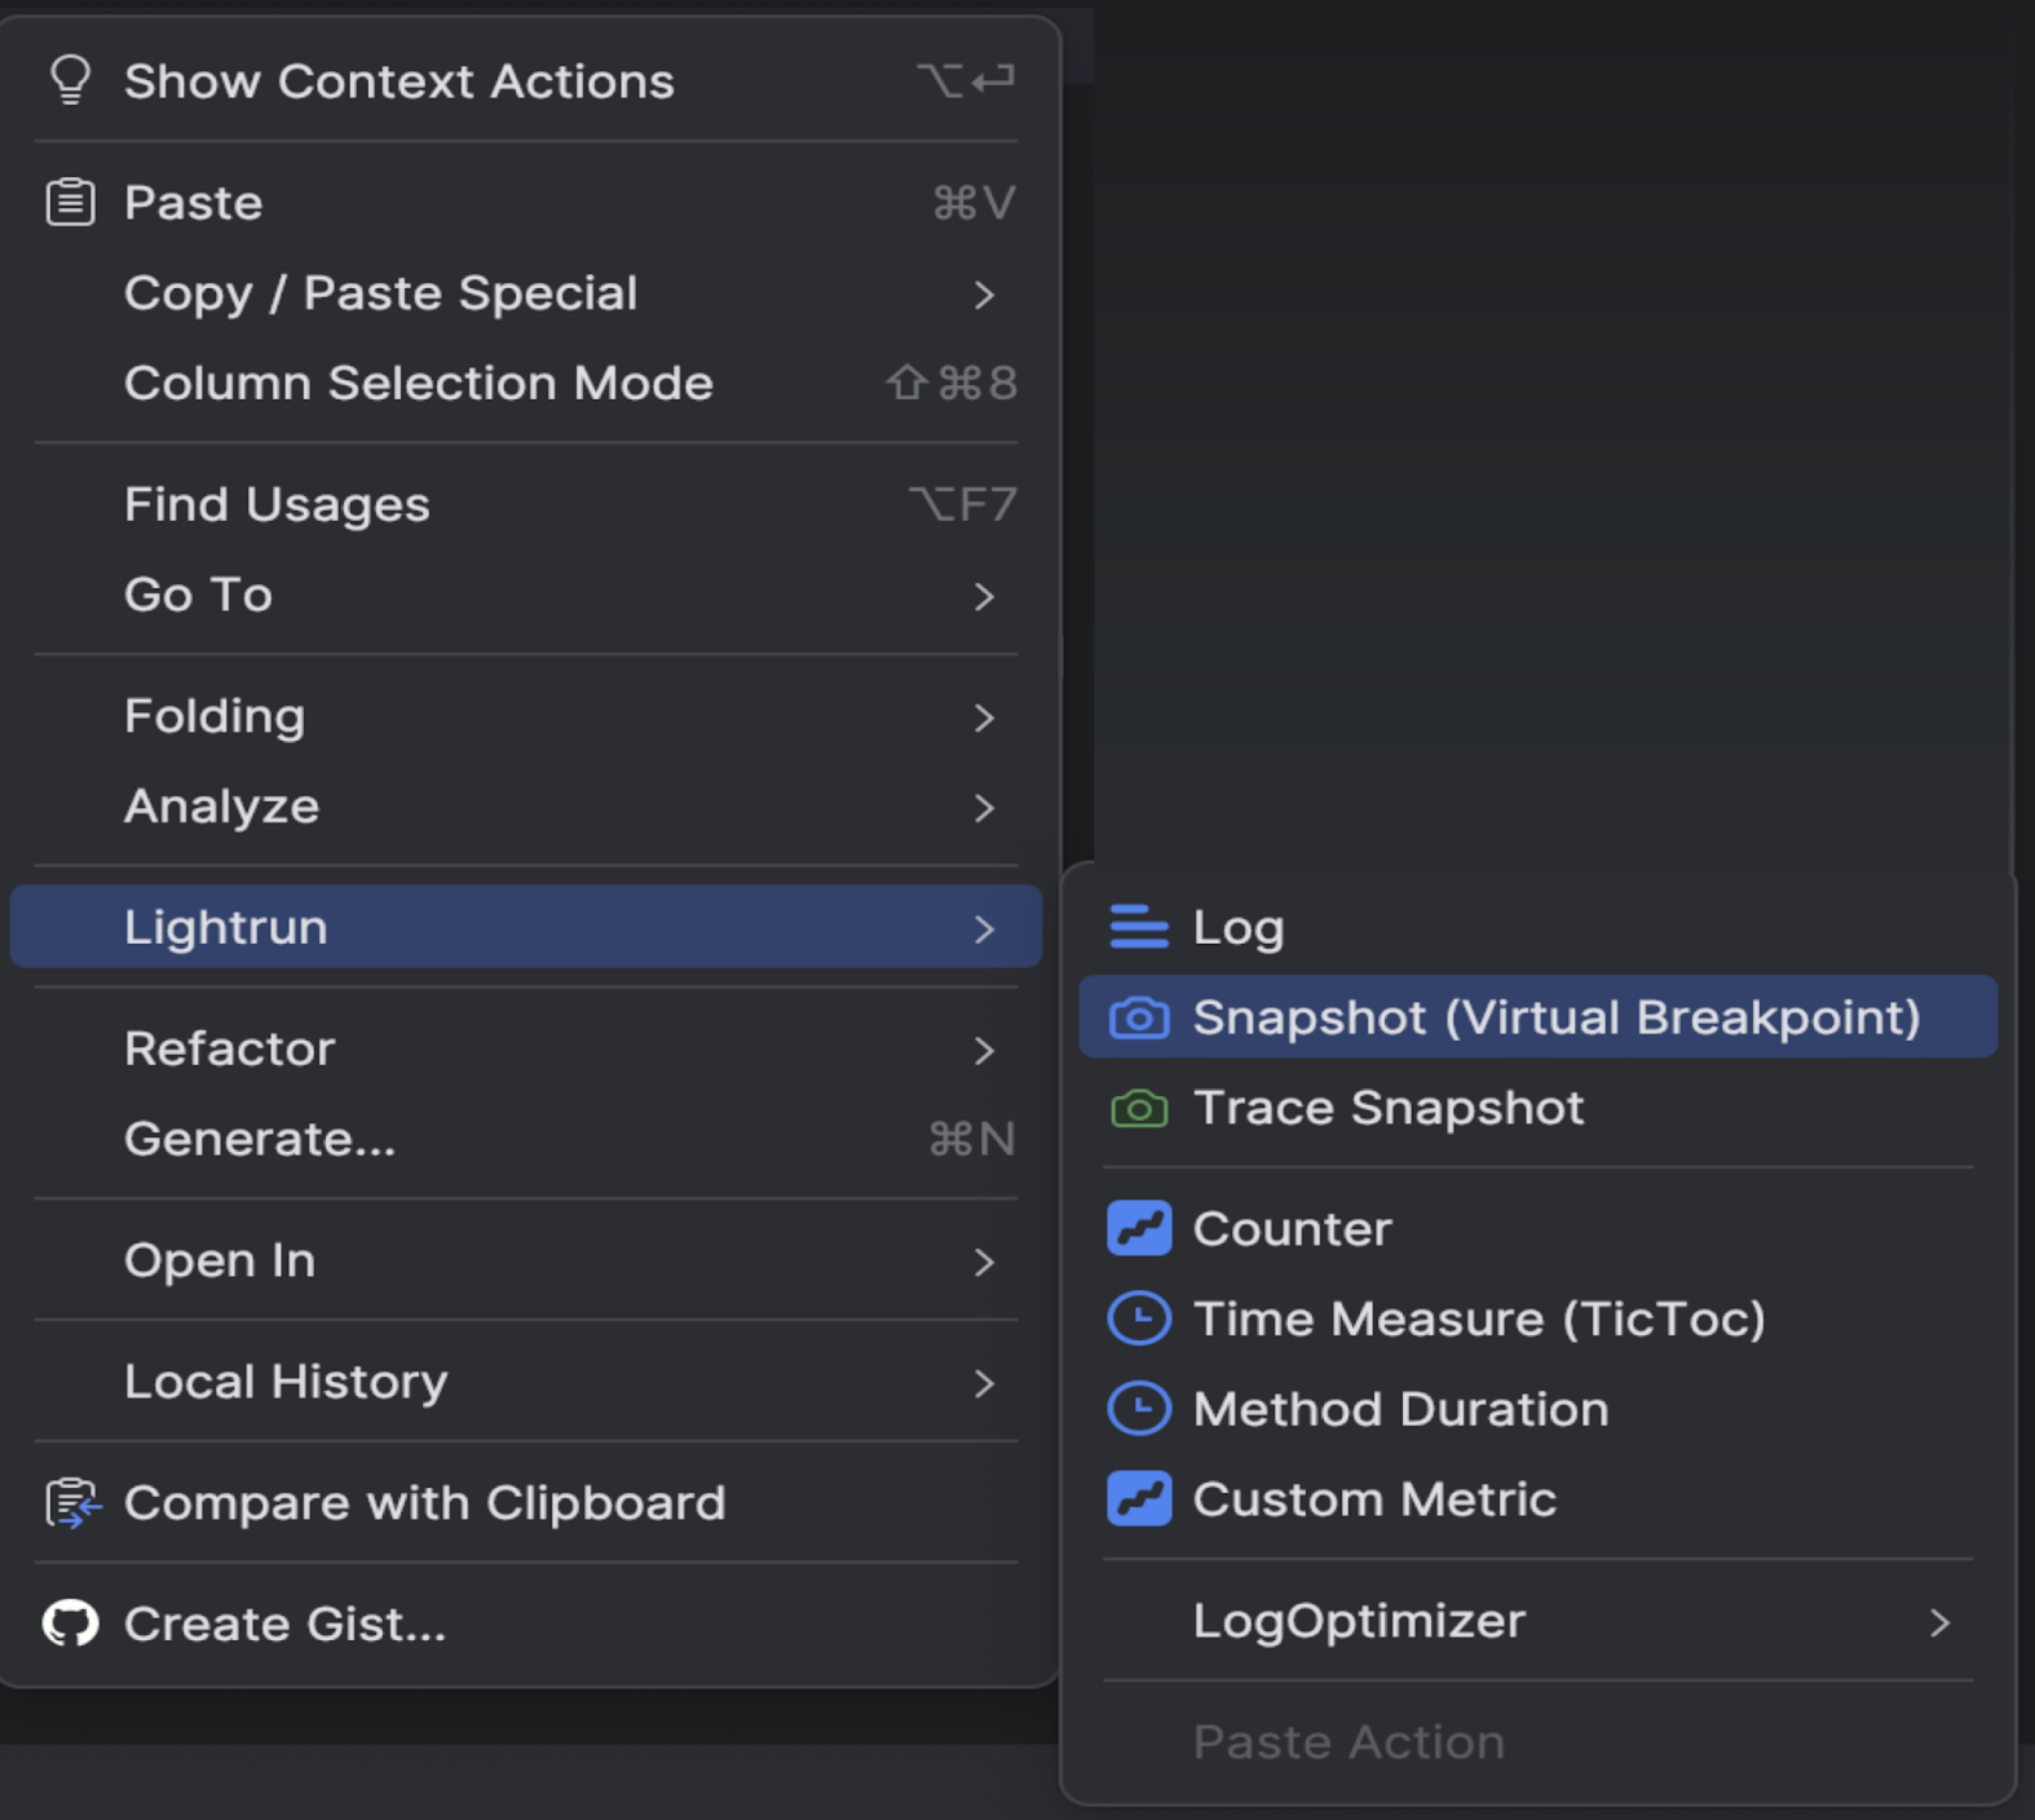
The Create Log dialog should appear similar to the following image.
-
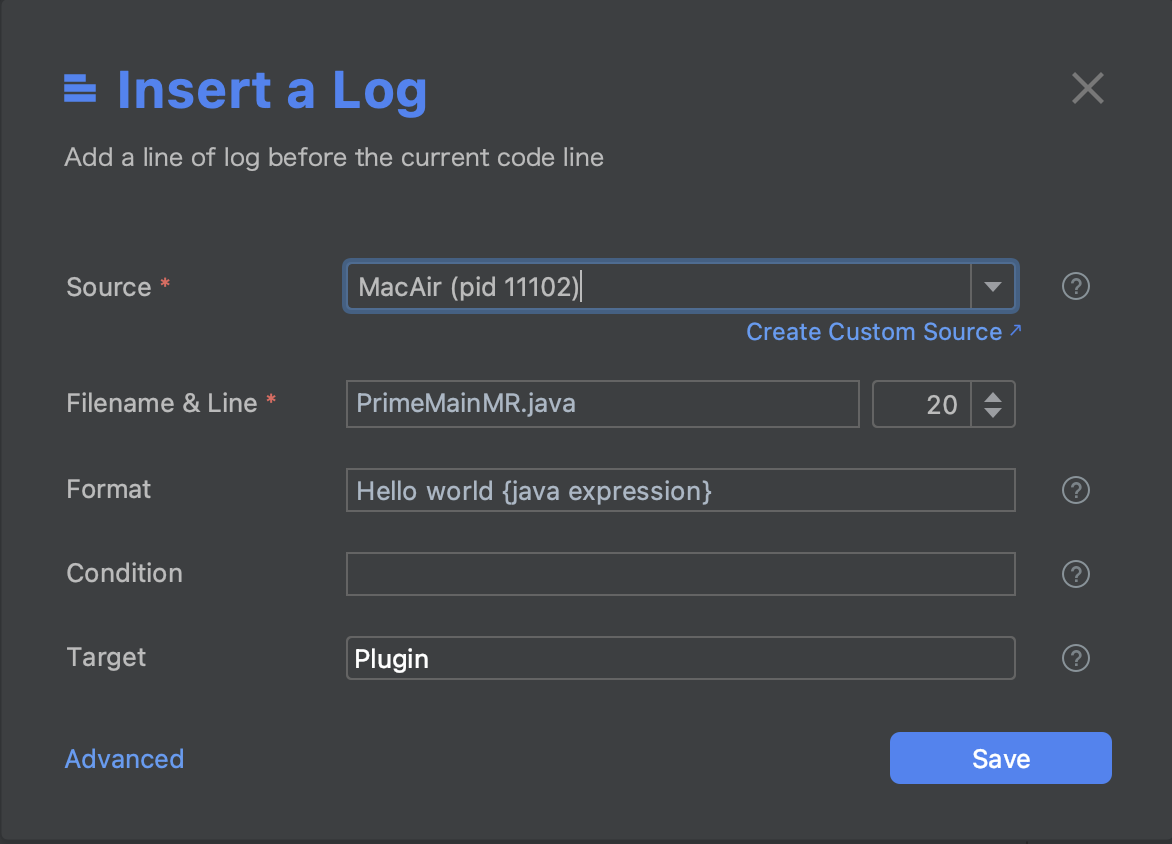
Complete the fields in the dialog as follows:
Fields Description Source From the available options in the dropdown list, bind the action to a specific agent, tag, or custom source.
Click Create Custom Source to create a new custom source.Filename & Line The source code file into which you're inserting the action. The default path is to the source code file from which you're currently working. Format The actual log string. Use expressions such as My variable is {var}, including method invocations such as:Method value: {myMethod() + 5}.Targets Select your preferred action output target. You can pick either:
- Stdout - Logs are routed only to your application's standard output.
- Plugin - Logs appear in the Lightrun Console, the Lightrun Management Portal, and configured integrations.
or both options at once.Condition The condition of an ifstatement, used to limit the execution of the action.
For example, The conditionmyVar % 7 == 0limits the action (log, snapshot, metric) output so that it only prints for variables that are divisible by 7. -
Click Advanced to configure the following additional fields:
Fields Description Ignore Quota The quota (rate limit) is configured by the agent configurations.
Only users withIGNORE_QUOTArole can override an agent's quota limitation, theIGNORE_QUOTAcheckbox is disabled for other users.Expiry The time after which the action ceases to track code behavior and is automatically disabled; default = 1 hour. Level Select an appropriate log level: INFO, ERROR, DEBUG, WARN.
Once configured, logs can also be filtered by the LOG LEVEL attribute in the Lightrun console. -
Click Save to add the log to your code.
Use Lightrun Lambda Logs to debug Java lambda expressions🔗
Note
Lightrun Lambda Logs are supported from version 1.48.1.
Debugging Java lambda expressions and stream operations in JetBrains is simplified with Lightrun Lambda Logs. Java Streams can be particularly challenging to debug due to their encapsulated iteration logic, which makes it difficult to trace how specific values are processed.
Lambda Logs provide a more precise debugging method by enabling you to place them adjacent to a lambda expression. This precision helps analyze complex data transformations, identify issues in functional programming logic, and address the unique challenges of debugging lambdas.
When adding a log, Lightrun automatically detects lambda expressions on the selected line and offers options to place the log either on the entire line or directly next to the detected lambda expressions. The dialog title confirms that a lambda log has been selected. All operations—including adding, viewing, editing, and deleting—work the same for lambda logs as they do for line-based logs.
-
Navigate to the line of your source code containing the lambda expression where you'd like to insert the log, and position the logs next to it.
-
Right-click to open the context menu.
The Insert a Lambda Log dialog opens.
The fields are identical to the line logs.
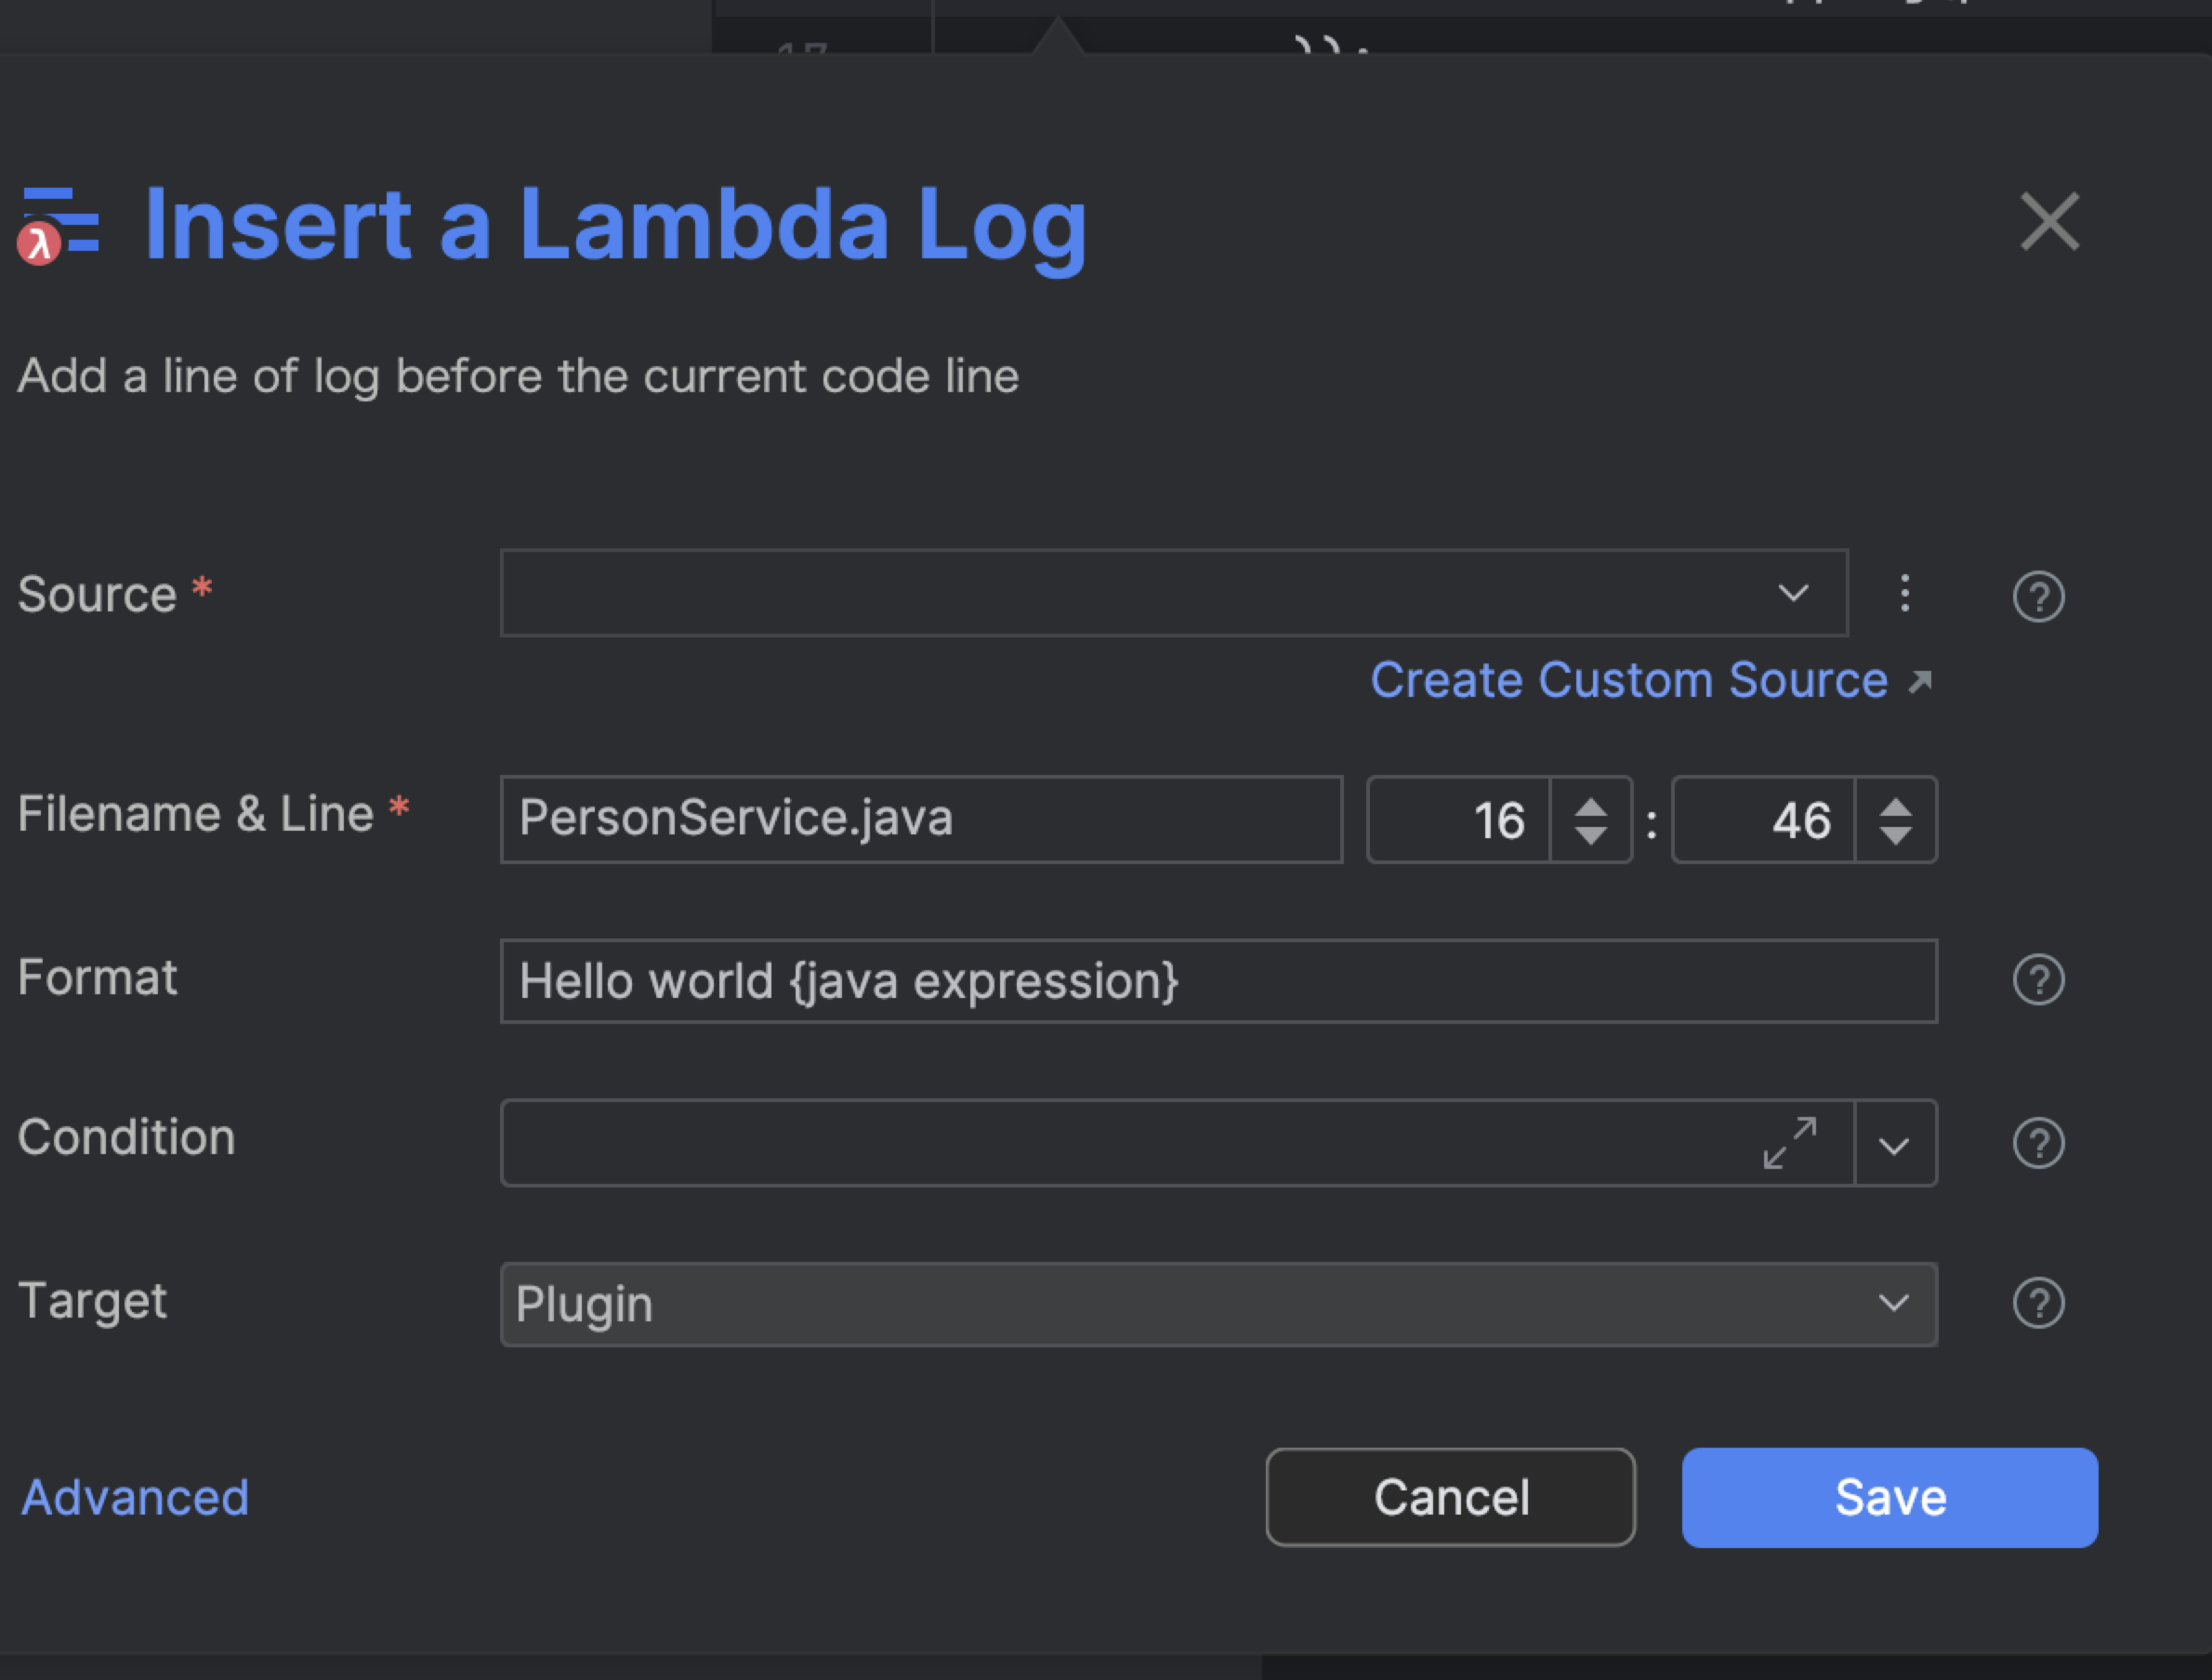
-
Complete the fields and click Save to add the lambda log.
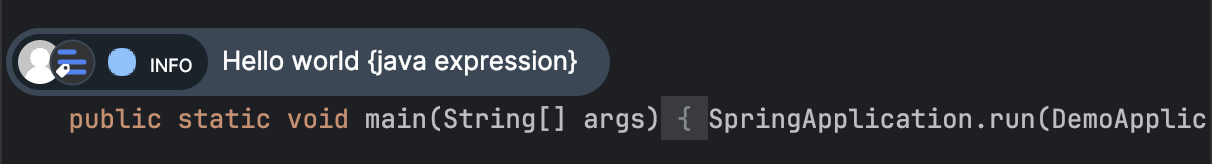
The lambda log is added next to the selected code line and is added to the Actions tab, aside line logs.
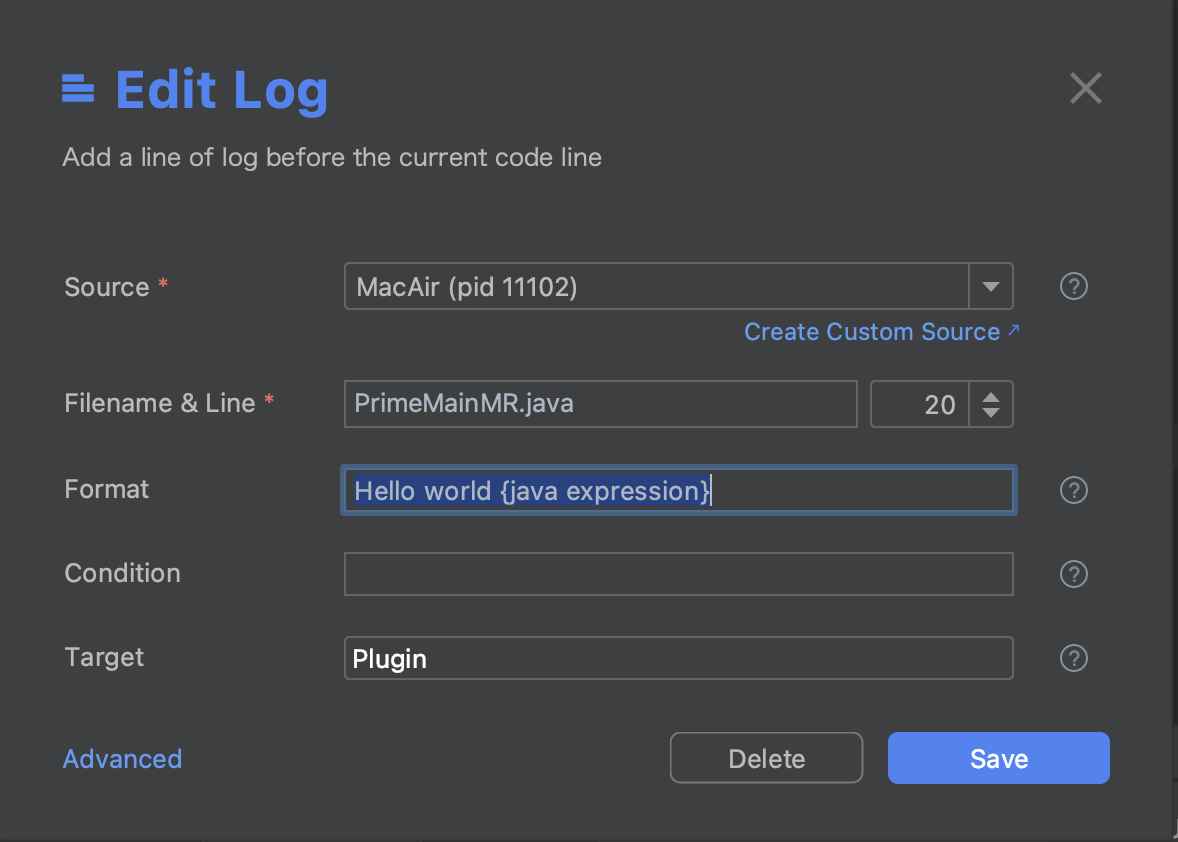
When working with lambda logs, the dialog titles indicate you are working on a Lambda log. All operations—including adding, viewing, editing, and deleting—work the same for lambda logs as they do for line-based logs. For more information, refer to the relevant sections above.
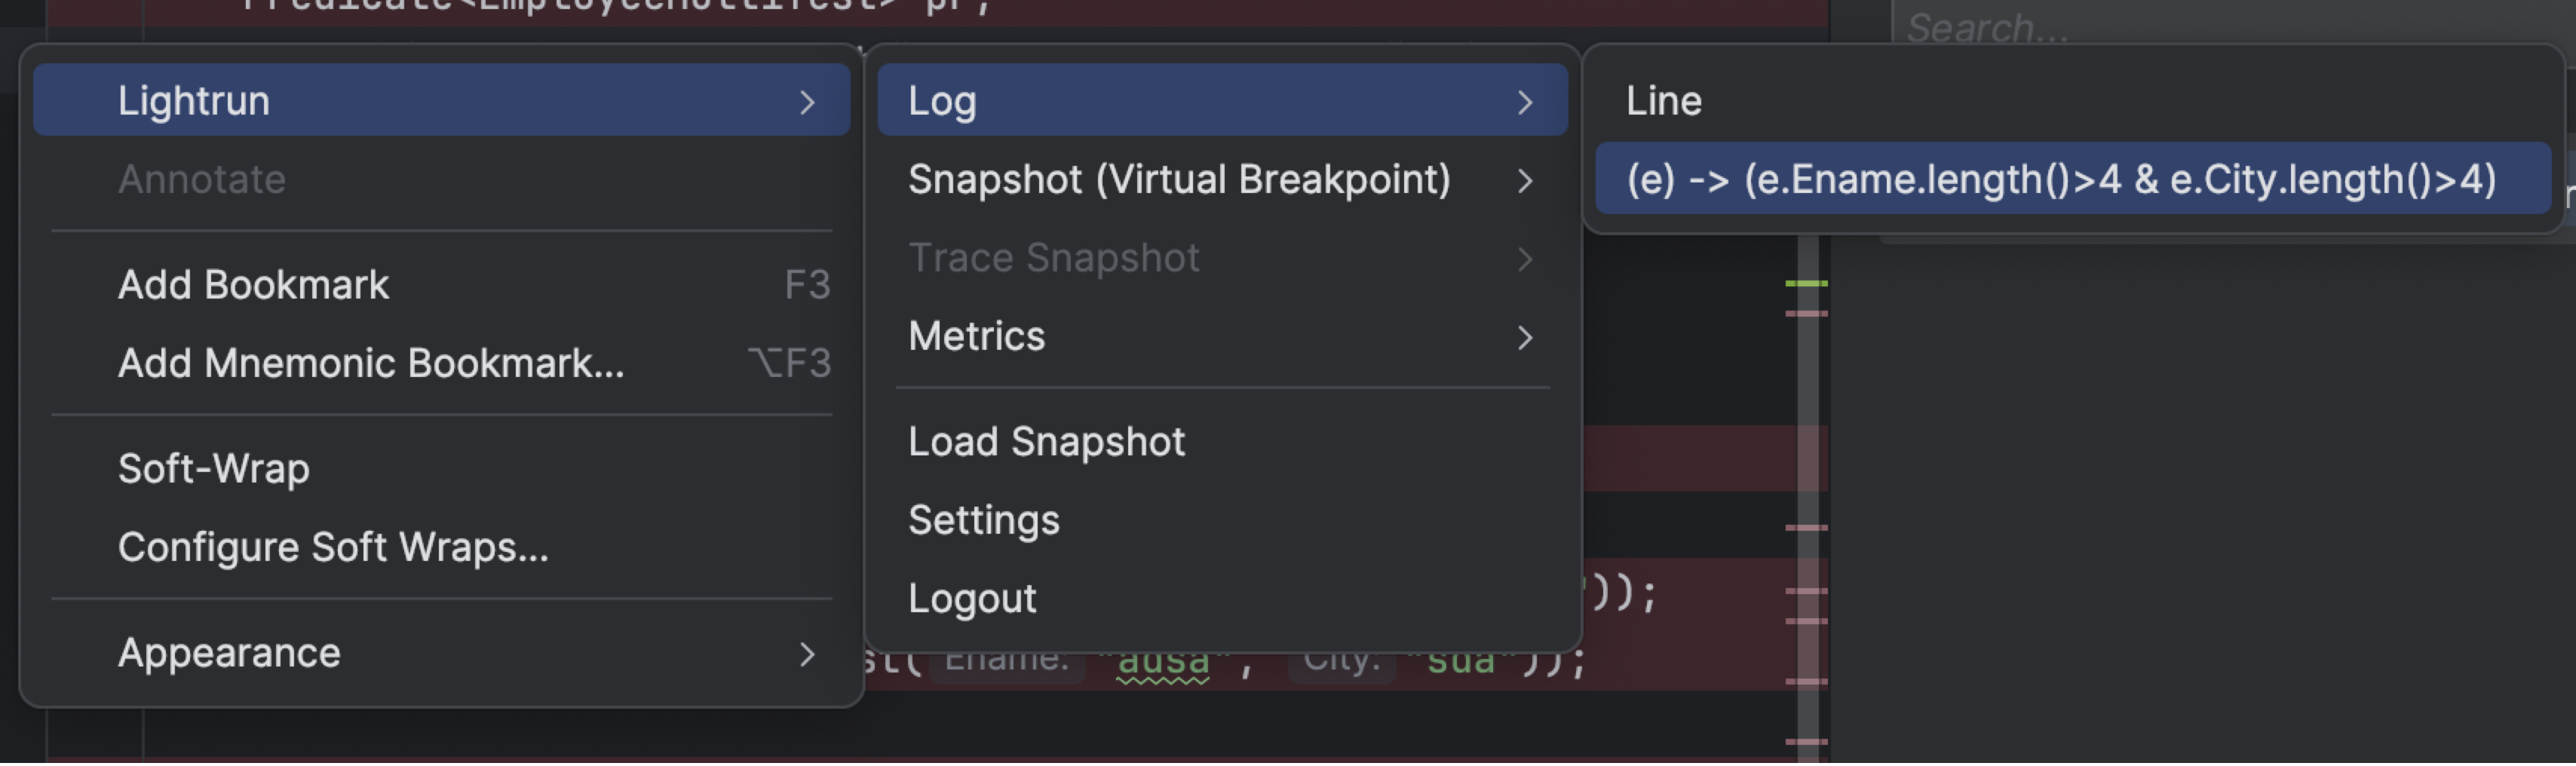
The following tutorial demonstrates how to a add a lamda snapshot. For a line containing the lambda expression (e) -> (e.Ename.length(0 > 4 && e.City.length() > 4), the lambda expression is automatically detected.

Manage Logs🔗
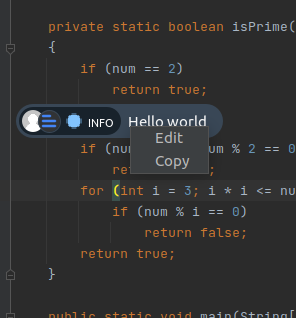
Once a log action has been inserted into your code, a log marker should appear on the code line where the action was added.
Right-click on the log marker to view more information about the log.
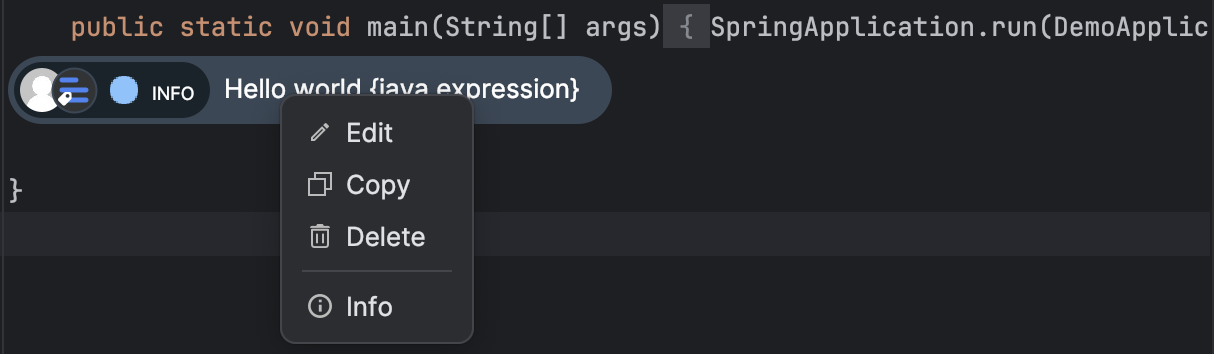
Click the log marker to edit or delete the log action.
Analyze logs🔗
Lightrun dynamic logs and metrics, by default, are printed into the application’s standard output(Stdout). This process enables them to be analyzed in the context of pre-existing logs or metrics, which might provide further clues towards solving issues.
At the same time, you can also configure your action target to Plugin. This configuration lets you view your dynamic logs and metrics output directly in your IDE through the Lightrun Console, the Lightrun Management Portal, and third-party integrated apps like Slack or Prometheus.
View logs and metrics from the JetBrains Lightrun Console🔗
Once you've configured your action target to Plugin and added at least one dynamic log or metric to your code, the Lightrun Console should display real-time output from the added dynamic log or metric.
See JetBrains plugin quick tour to learn more about the Lightrun Console tool window.
Copy and paste a dynamic log into your code🔗
This procedure allows you to easily reuse existing logs in multiple locations within your code. Note that the log is saved in the clipboard and can be pasted multiple times.
- Go to the line in your application source code where you'd like to copy the log.
- Right-click on the log.
-
Click Copy to copy the log settings.
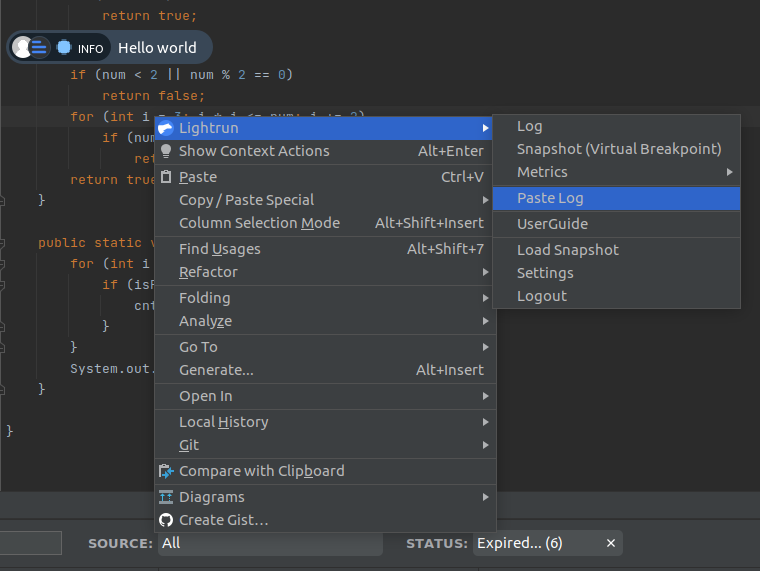
-
Go to the line of your target source code at which you'd like to insert the copied log, right-click and click Paste Log.