Debug using the Lightrun Autonomous Debugger in JetBrains🔗
The Lightrun Autonomous Debugger, powered by Generative AI, automates runtime debugging directly into your IDE. It streamlines the troubleshooting process from ticket to fix, helping developers quickly pinpoint application issues—even in mission-critical production workloads. For more information, see Lightrun Autonomous Debugger overview.
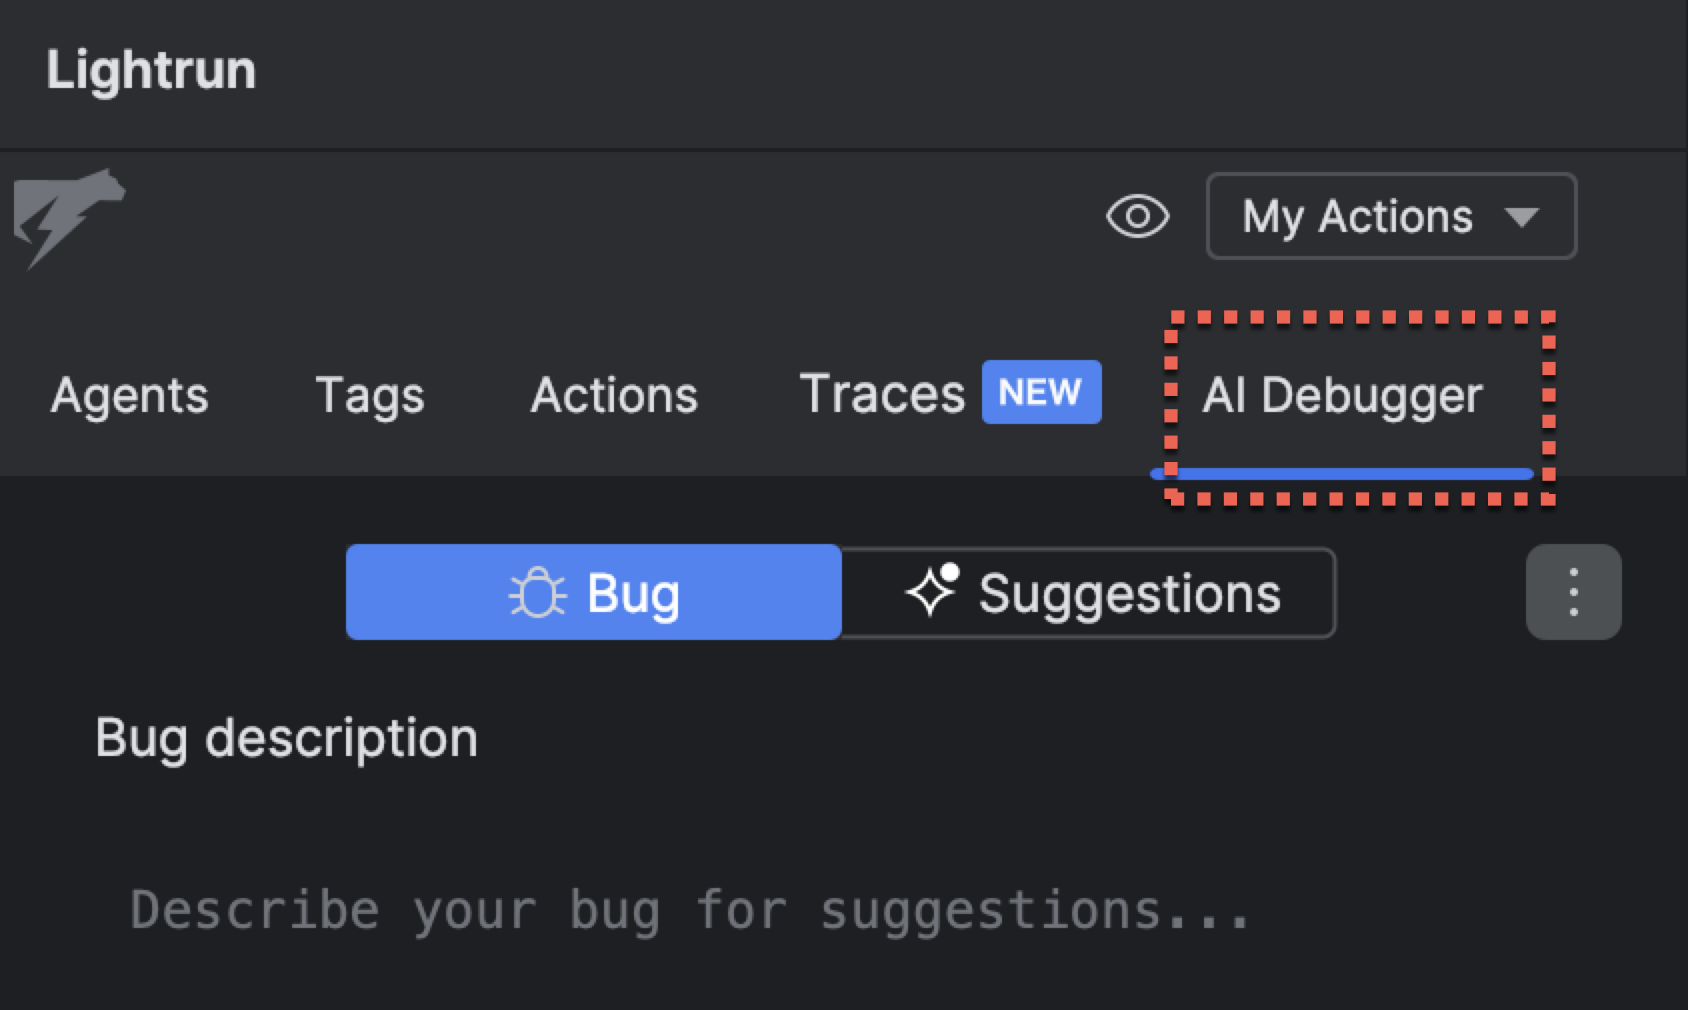
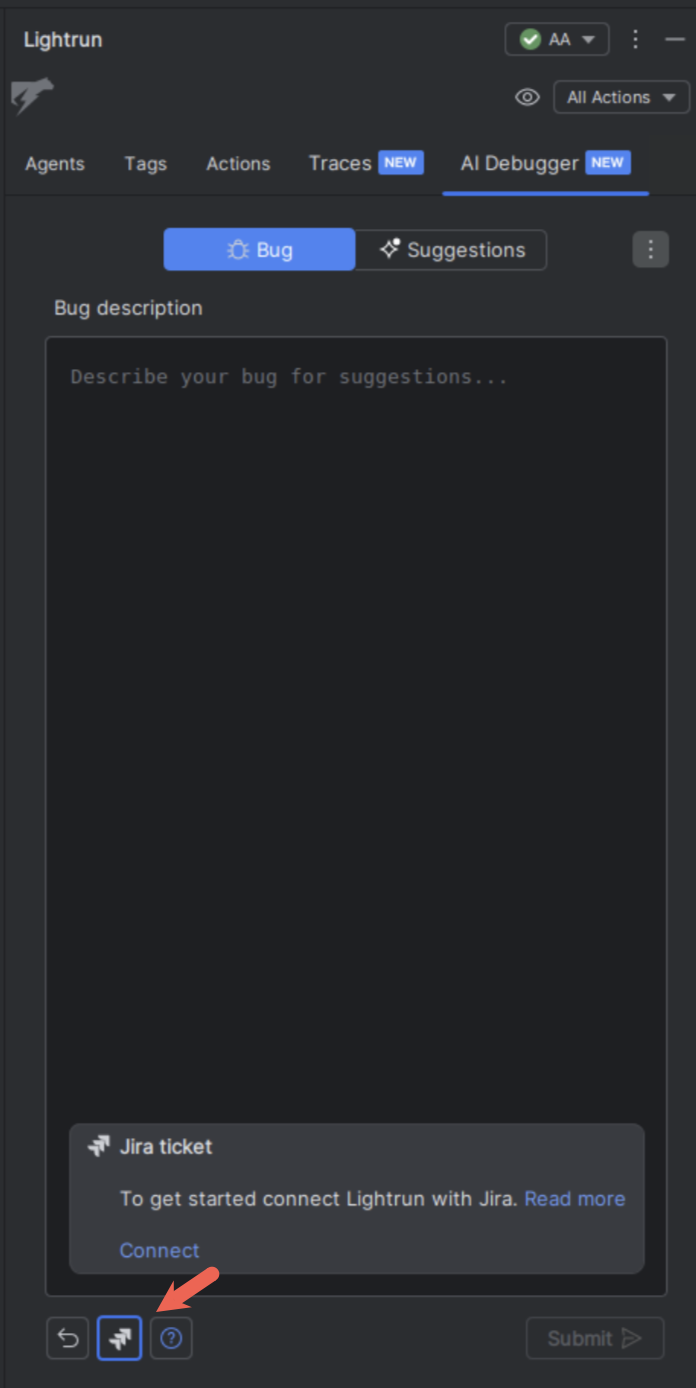
The Autonomous Debugger is located in the AI Debugger tab in the Lightrun JetBrains plugin. It contains two main sub tabs:
- Bug: Enter a description of your bug.
- Suggestions: Lightrun AI-generated suggestions based on the bug you report and the project files that were indexed.
Before you begin🔗
The Autonomous Debugger requires a few additional setup steps beyond the standard Lightrun plugin. For detailed environment compatibility, see Autonomous Debugger system requirements.
To use the Autonomous Debugger in JetBrains IDEs, ensure the following:
- The Lightrun plugin is installed in your local IntelliJ instance.
- You are authenticated in IntelliJ with your Lightrun account.
- The source Git branch (source branch for the running application) is open in the IDE.
Preliminary stage: Automatic project indexing🔗
The Autonomous Debugger indexes your open project automatically when you open it on the source Git branch. Index data is stored locally in the ~/.lightrun folder. Switching branches or projects requires manual reindexing.
Switching branches or projects requires manual reindexing.
To reindex manually:
- In the JetBrains Lightrun plugin, click the AI Debugger tab.
-
Click
 and select Reindex Project.
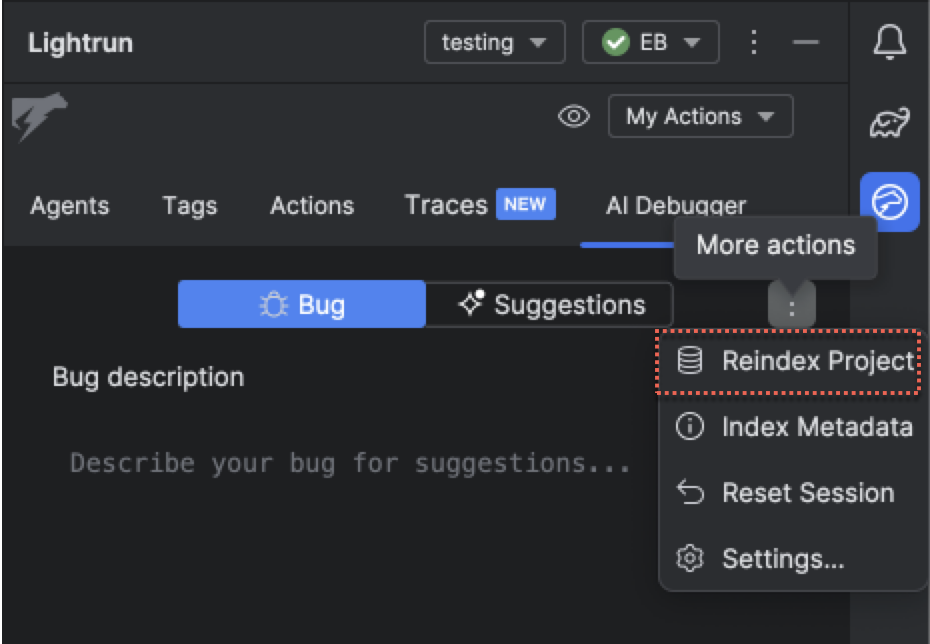
A message confirms successful indexing.

Debug with the Autonomous Debugger🔗
The Lightrun Autonomous debugger performs real-time code analysis to autonomously identify software issues, following a streamlined incident-response flow. It facilitates the entire process, from ticket to fix, all within the JetBrains native environment (IDE).
Step 1: Describe the issue🔗
To get the best results, ensure your prompt is as detailed and focused as possible. The more information you provide, the better the AI can help you identify the root cause of the issue. For tips on optimizing your prompts, refer to our guide on Best practices for prompts in Lightrun Autonomous Debugger.
Tip
To get quick guidance on how to phrase your prompt, click ![]() located next to the Submit button.
located next to the Submit button.
-
In the Lightrun plugin, go to the AI Debugger tab and click on the Bug tab.
To get quick guidance on how to phrase your prompt, click
 located next to the Submit button.
 -
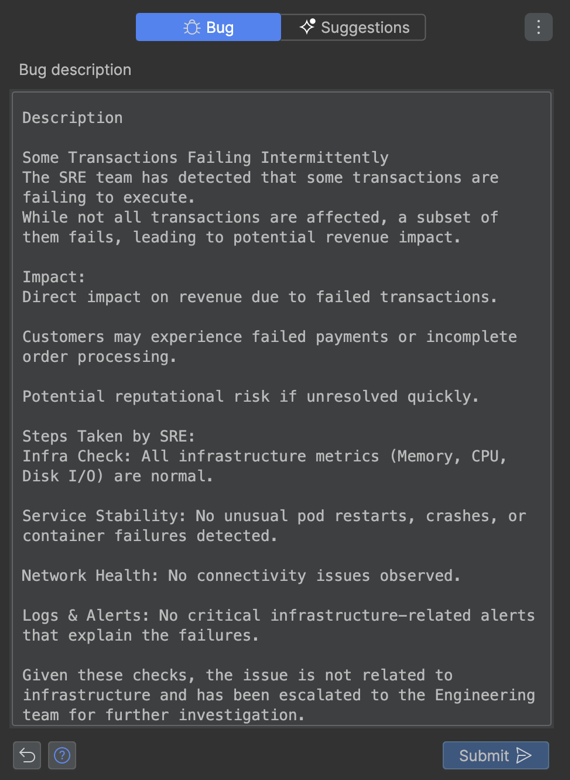
To start, describe your issue in the Bug tab, use the following methods:
-
Type your own prompt.
-
Populate data from Jira directly to the Bug tab.
From version 1.62, you can populate the Bug tab with your Jira ticket data via the Jira connection option.
You need to first set up the inital connection to your Jira instance. For more information, see Jira connect.
- In the JetBrains Lightrun plugin, click the AI Debugger tab.
-
Select the Bug tab, and click the Jira icon on the bottom left of the plugin.

-
Paste a Jira issue link or just the issue ID (e.g., instead of https://
/browse/DEV-xxxx, simply enter DEV-xxxx) into the Jira Issue box. This will automatically copy the title and description of the ticket into your Bugs pane. You can repeat this process with multiple Jira issues in the same session to add their descriptions to the relevant bug. -
Click Add.
The title and description are automatically pasted in the Bug tab.
-
-
Click Submit.
The Autonomous Debugger will automatically switch to the Suggestions tab and indicate that it is collecting context and generating hypotheses.
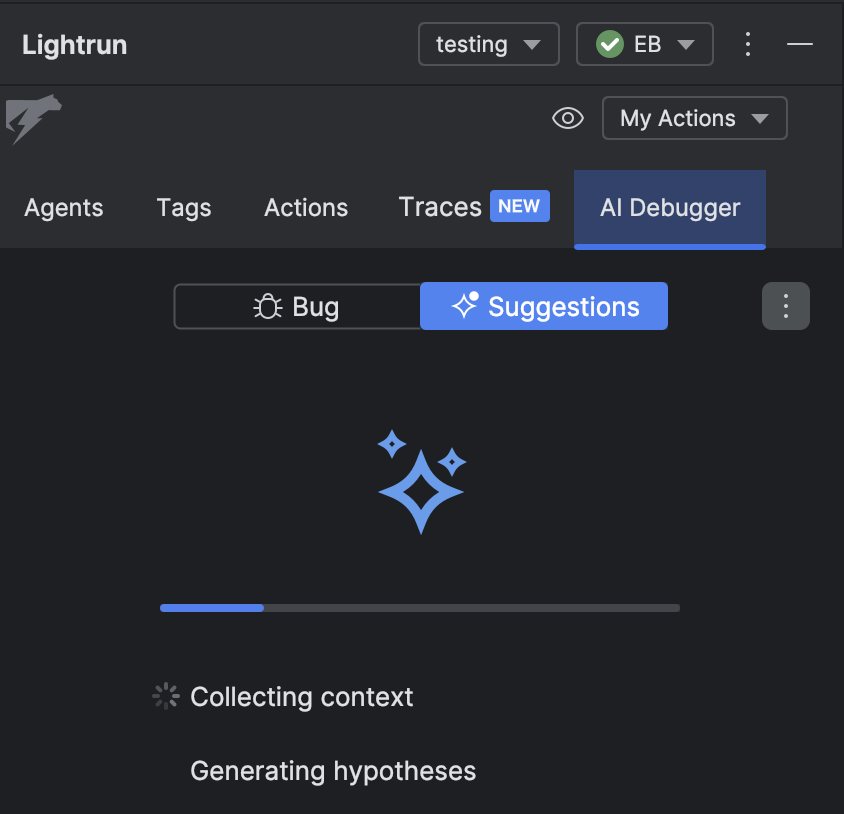
It will then begin analyzing your issue based on your prompt description, reviewing your indexed projects, and identifying the source code files likely associated with the reported issue.
Note that this may take some time depending on the number and size of your indexed files.
Step 2: Review suggestions🔗
Once the analysis is complete, the Autonomous Debugger provides up to 3 hypotheses. Each hypothesis includes a possible cause and files likely involved.
Upvote the most relevant hypotheses and downvote those that seem less likely. Your votes will not affect debugging but help improve future recommendations.
The following sample hypotheses are based on the bug description provided in the Step 1.
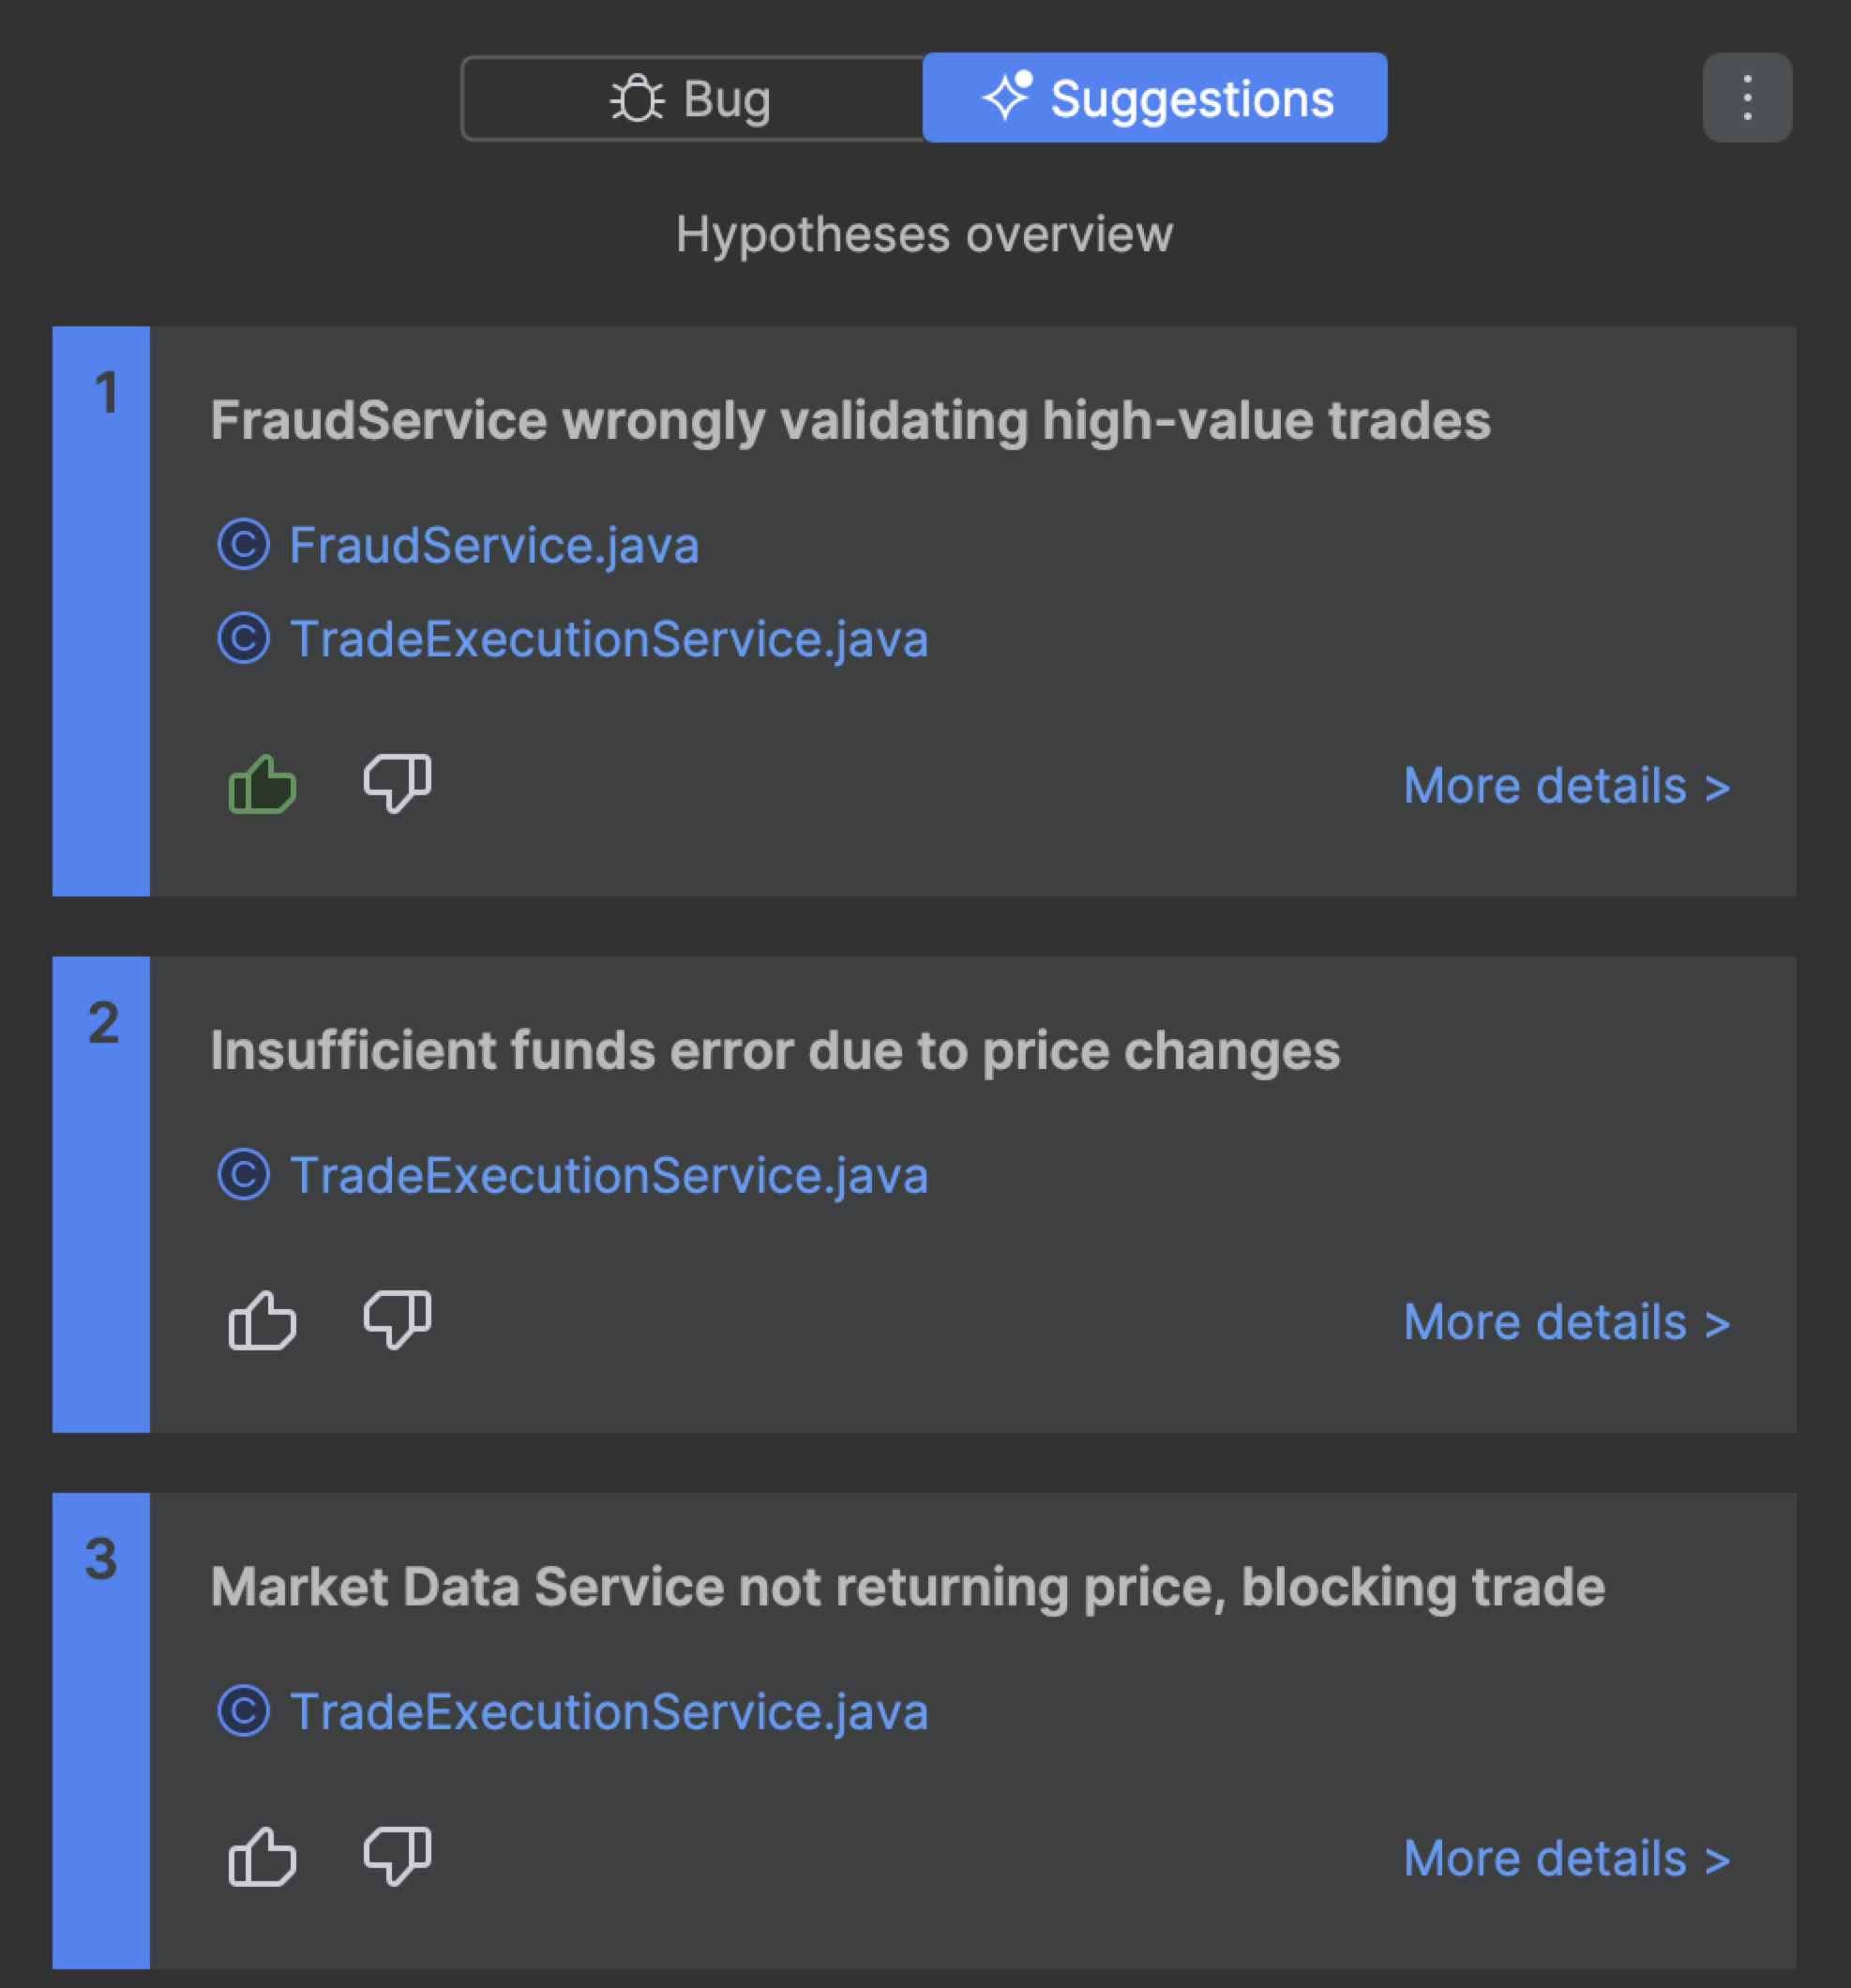
- Skim through the hypothesis summaries.
-
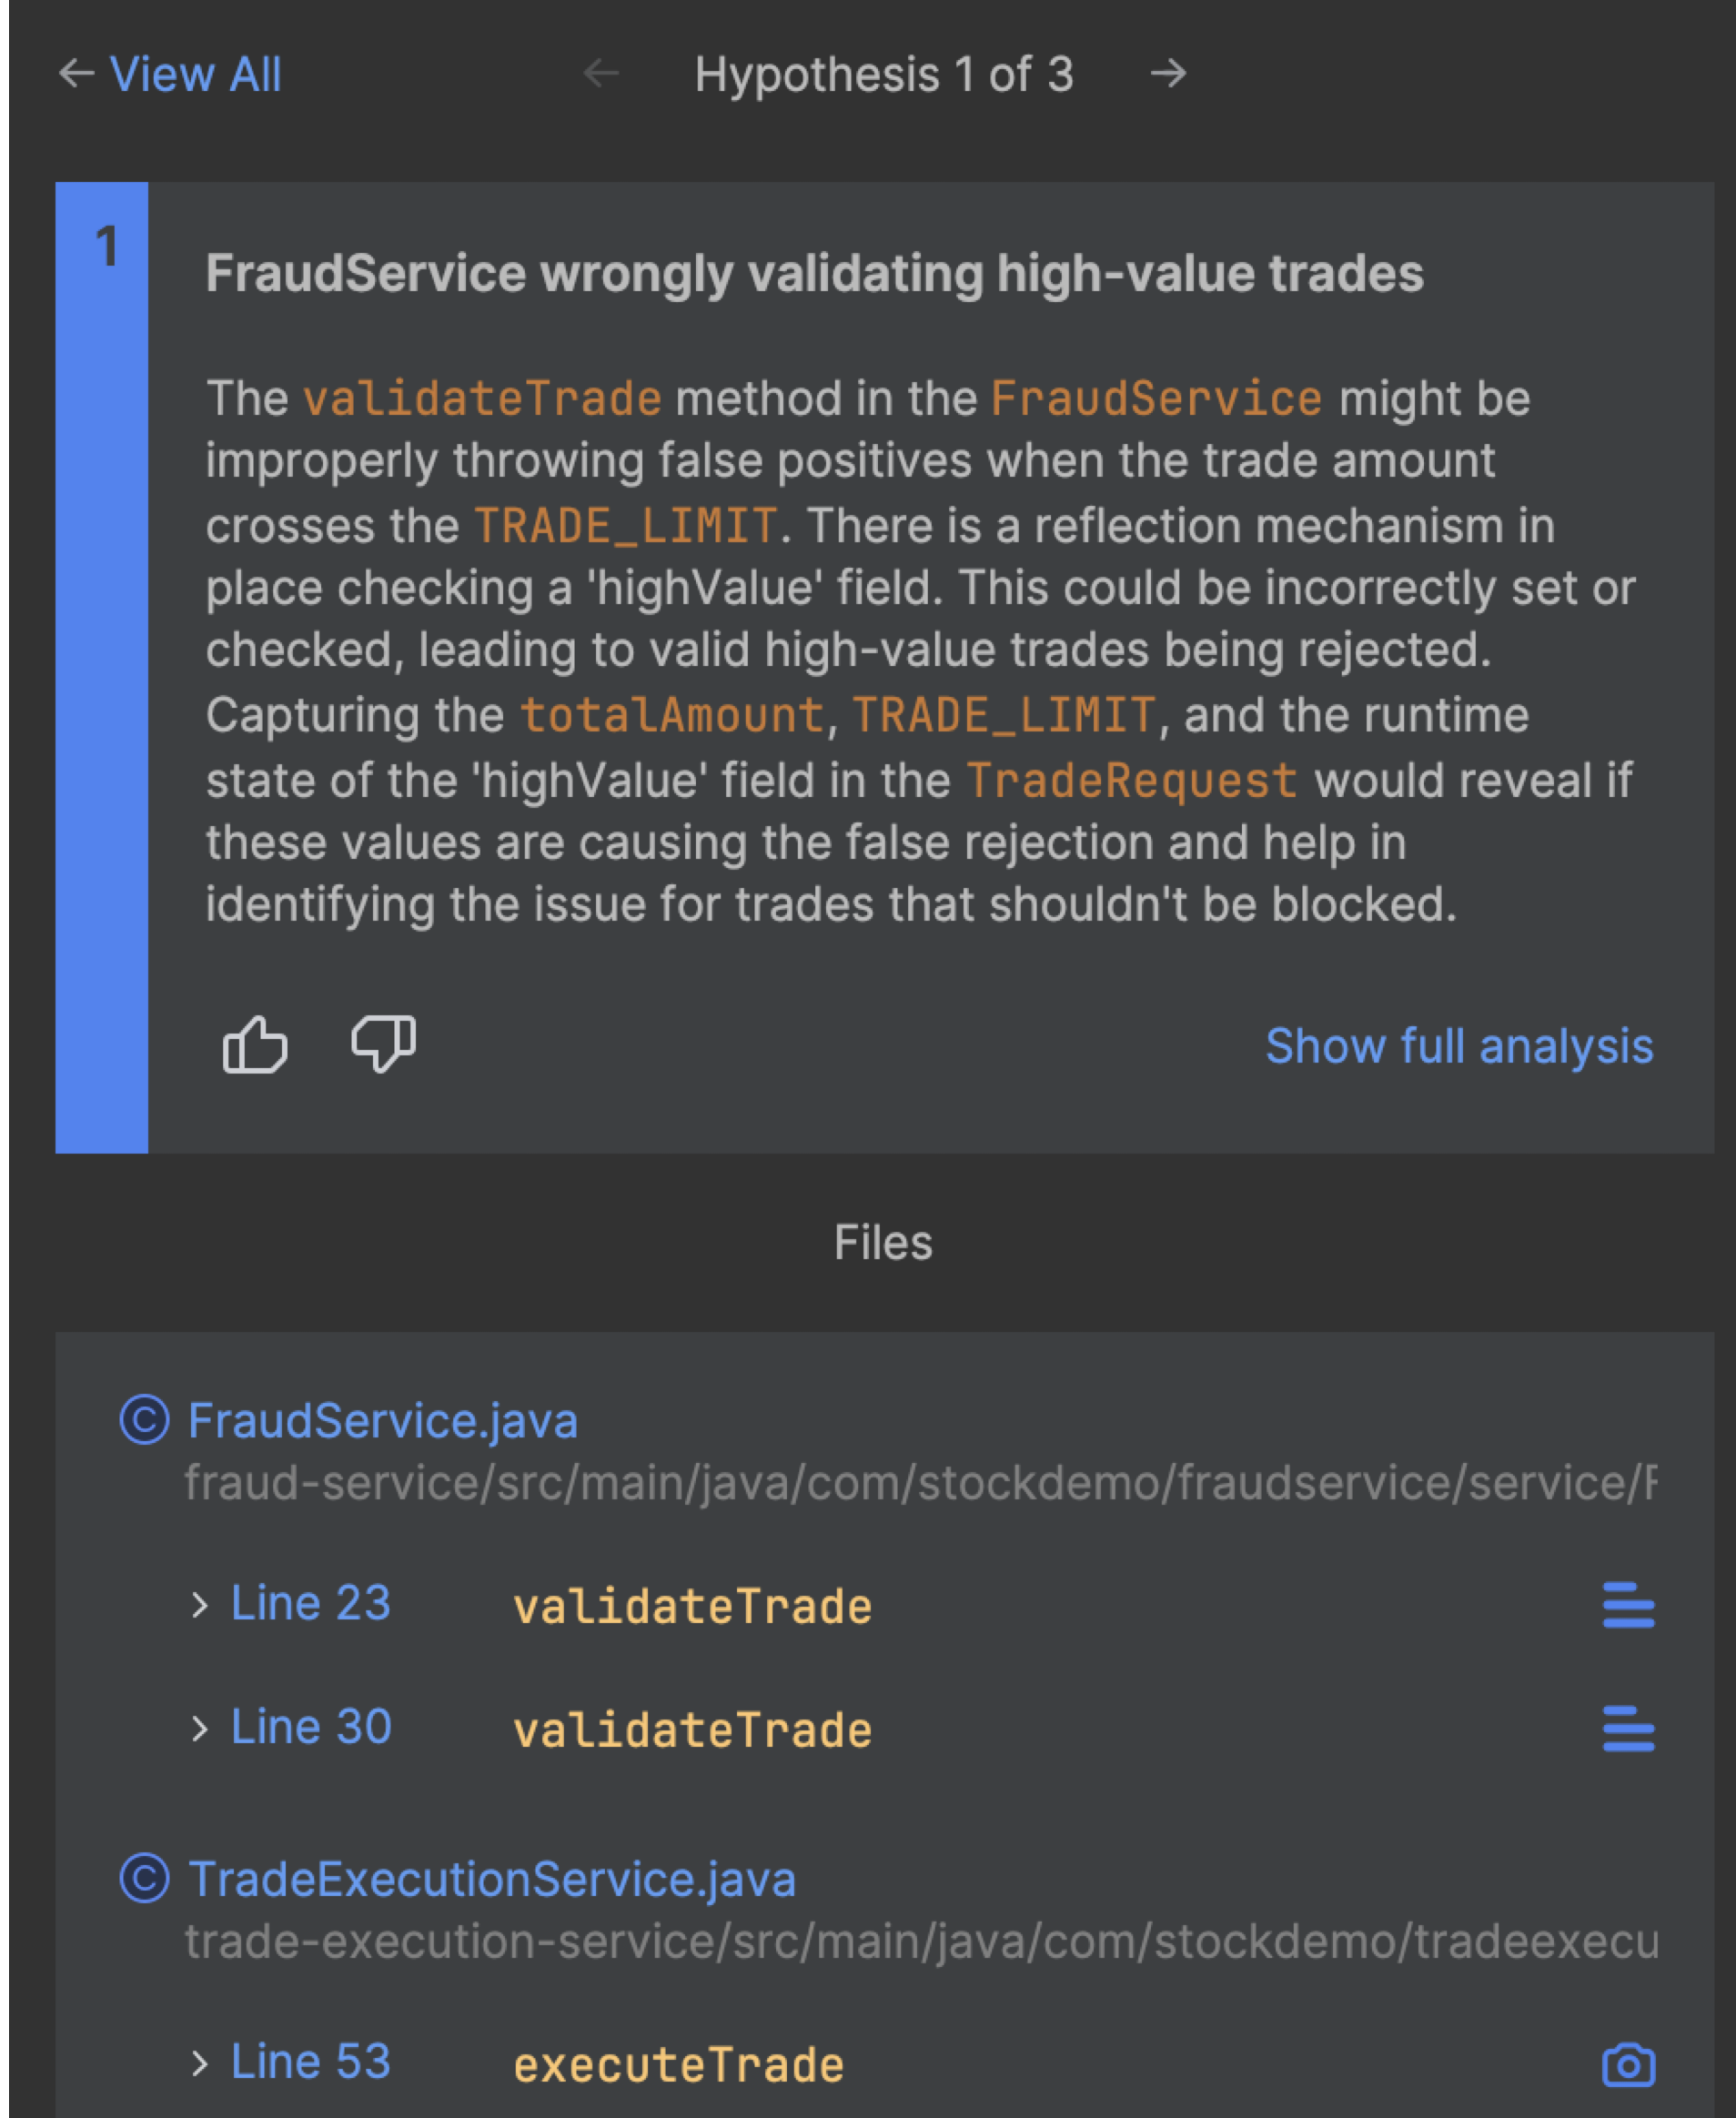
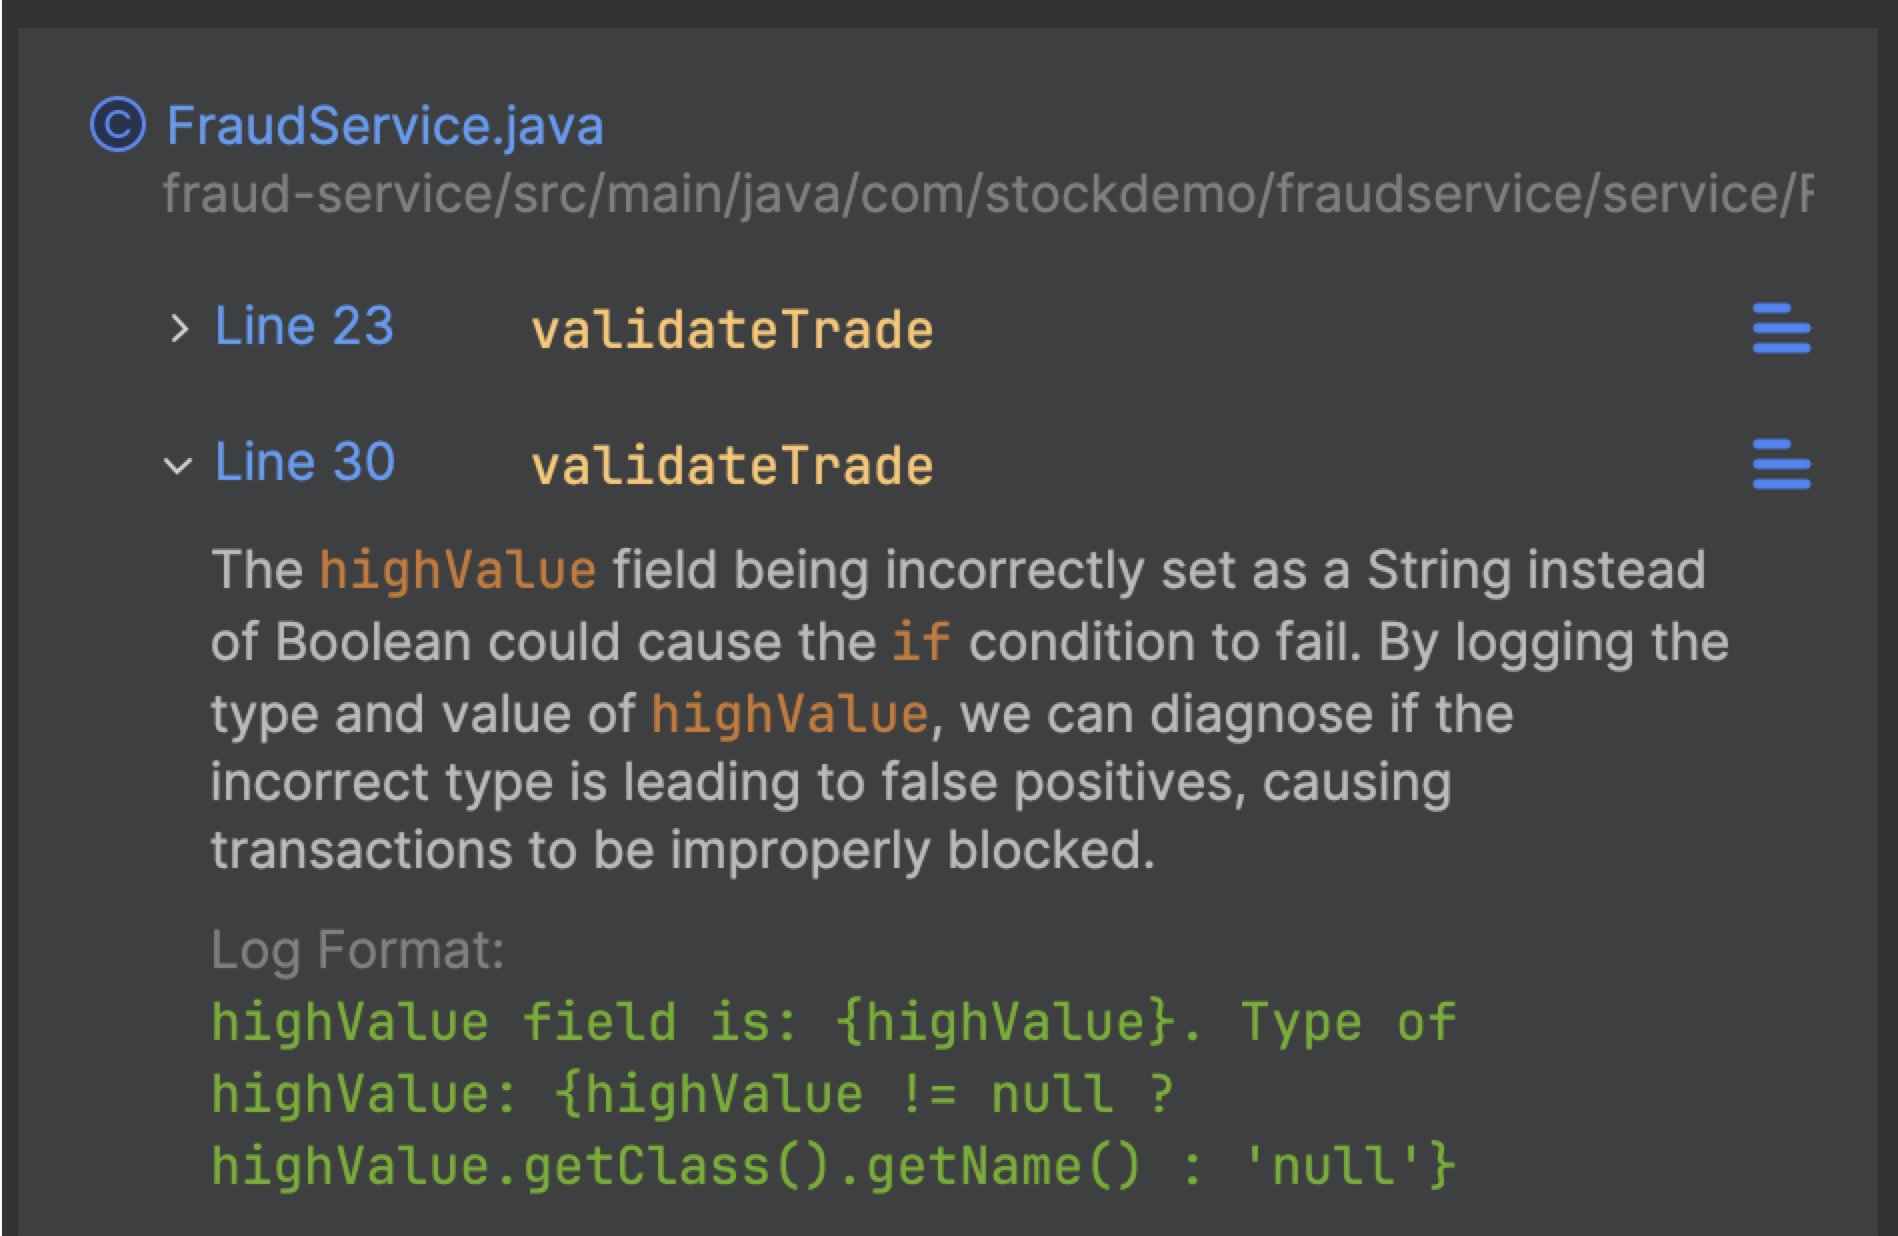
For a relevant hypothesis, click More details.
A detailed description appears, showing the code element involved and the reason for the issue. A list of files related to the issue is displayed, along with proposed lines where Lightrun actions can be added to validate the hypothesis.
-
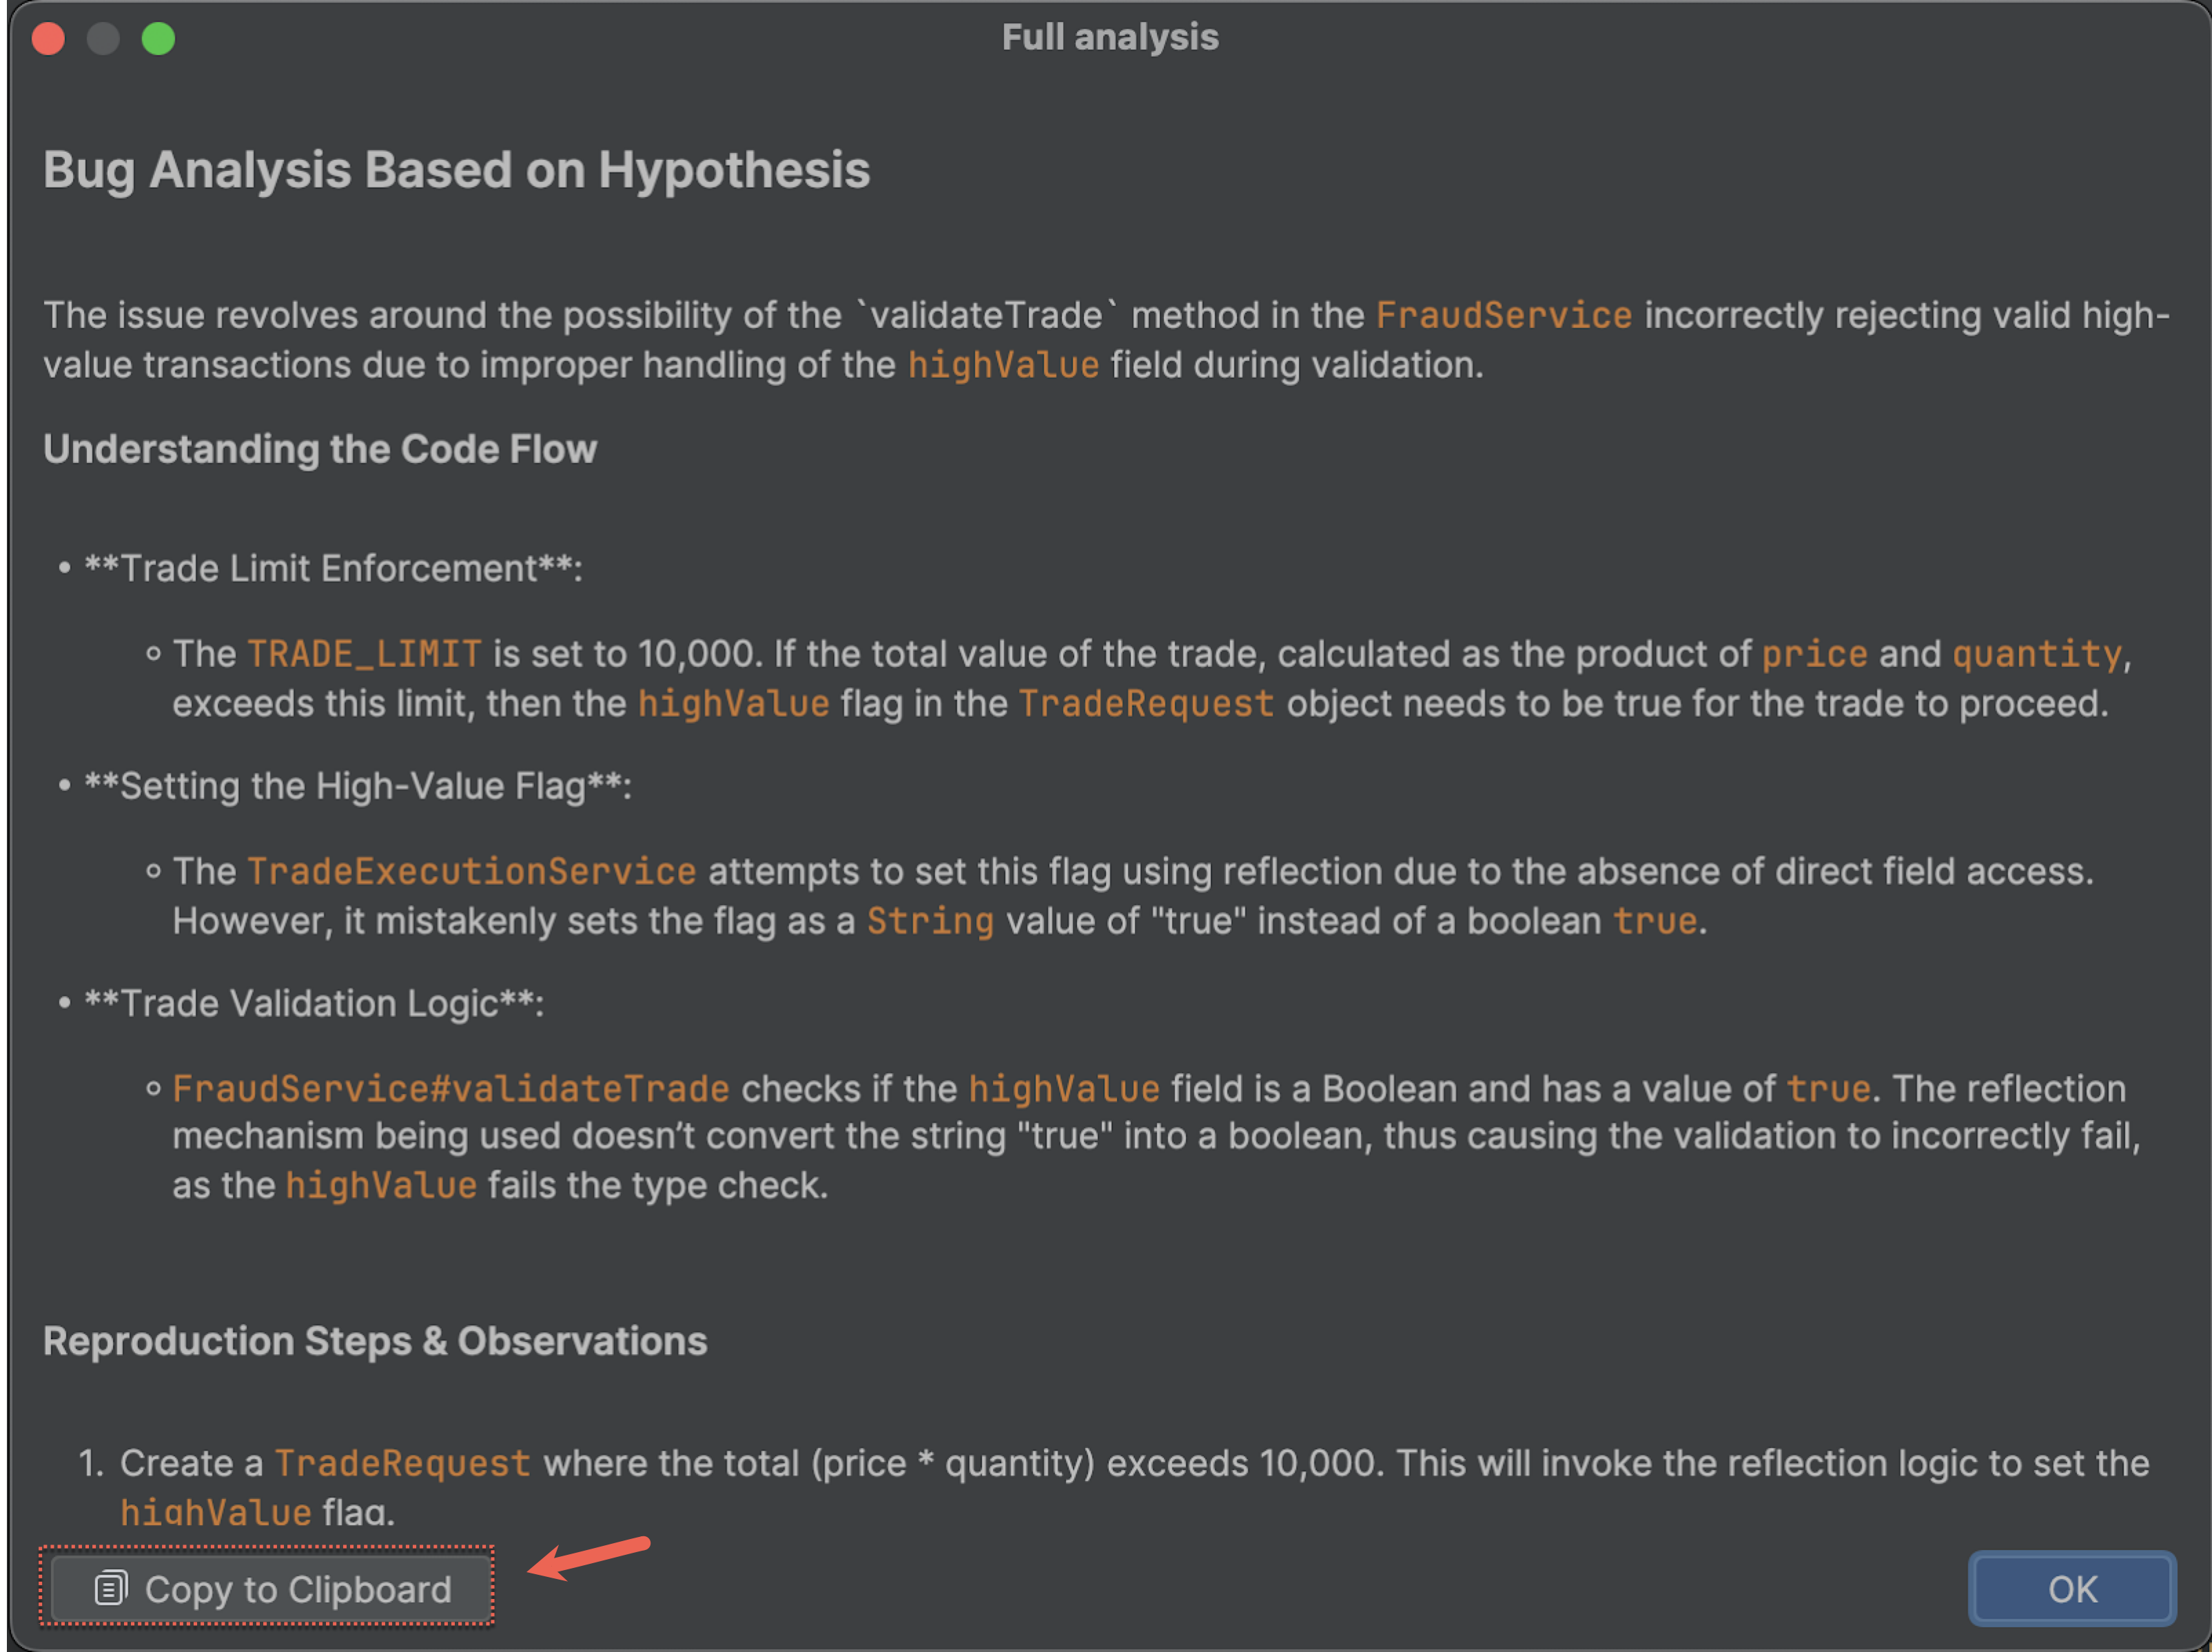
Click Show full analysis to learn more. The Full analysis dialog includes a detailed breakdown of the issue, root cause analysis, reproduction steps, and possible remediation advice.
You can click Copy to Clipboard to share the root analysis results with your peers.
-
Click OK.
Step 3: Remediate the issue with Lightrun Actions🔗
The remediation step begins based on the Autonomous Debugger’s suggested fix. After validating the suggestion, apply the recommended solution to resolve the issue. This may involve making code adjustments or implementing the proposed solution.
To verify the AI's suggestions, add Lightrun actions, such as logs, snapshots, or other real-time debugging methods. After applying the fix, the issue is remediated, and the system returns to normal operation, with the incident closed.
To start remediating the issue, return to the Hypothesis Overview view.
-
Click the relevant hypothesis and go to the Files section.
As displayed in the following example of a Log Suggestion.
A list of up to 8 debug suggestions are displayed and includes:
- A list of recommended Lightrun Logs and Snapshots that can be added to specific lines in your code to further debug the issue based on the selected hypothesis.
- Recommended expressions for gathering relevant information.
In parallel, Lightrun Suggested action icons appear in the list and in the gutter, indicating a debug suggestion to help validate your hypothesis.
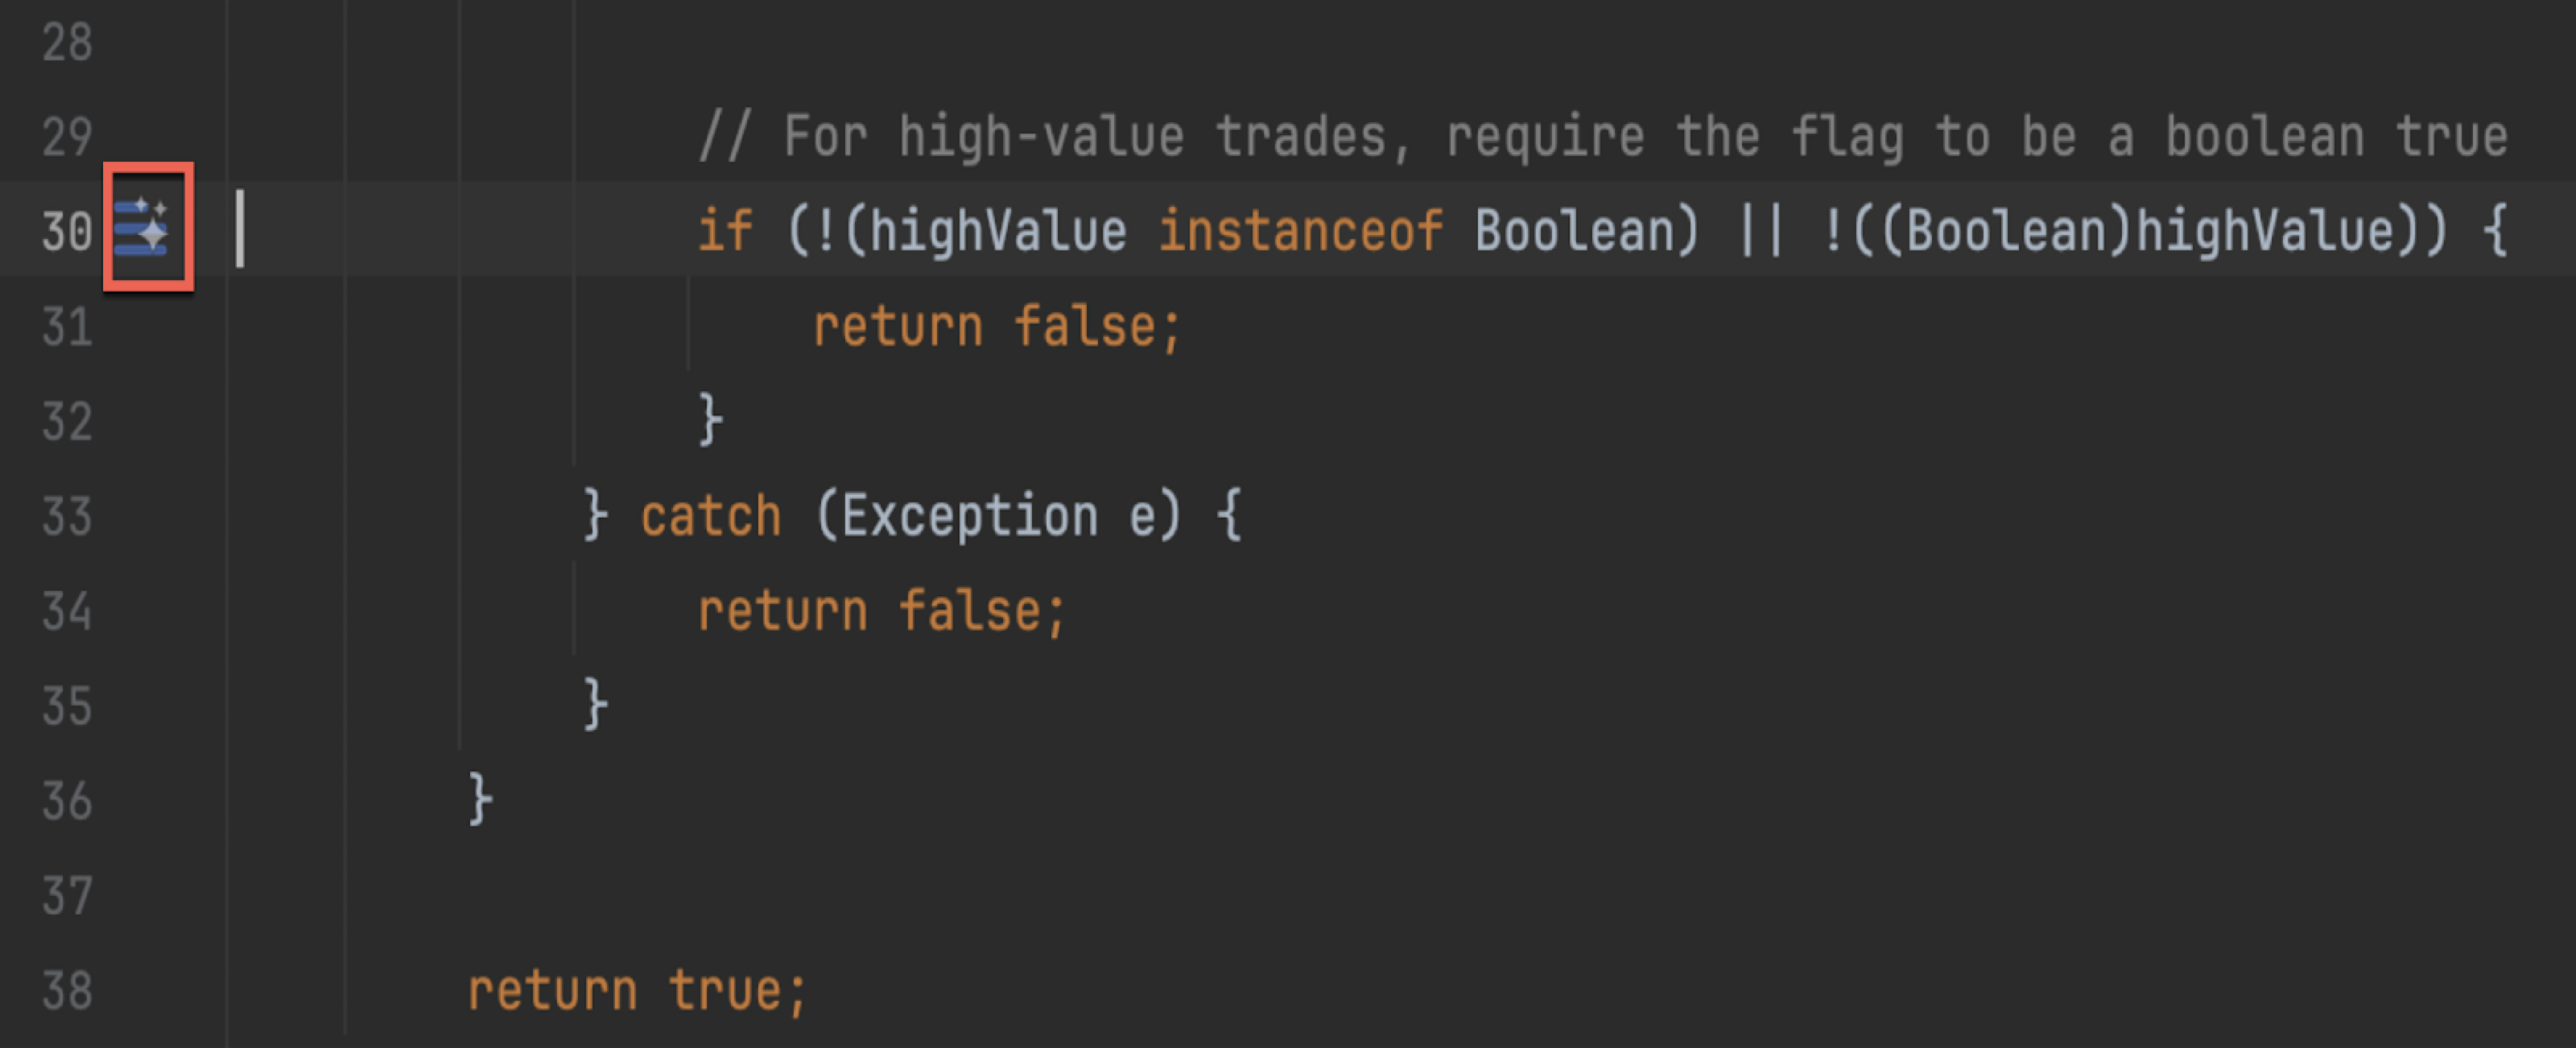
-
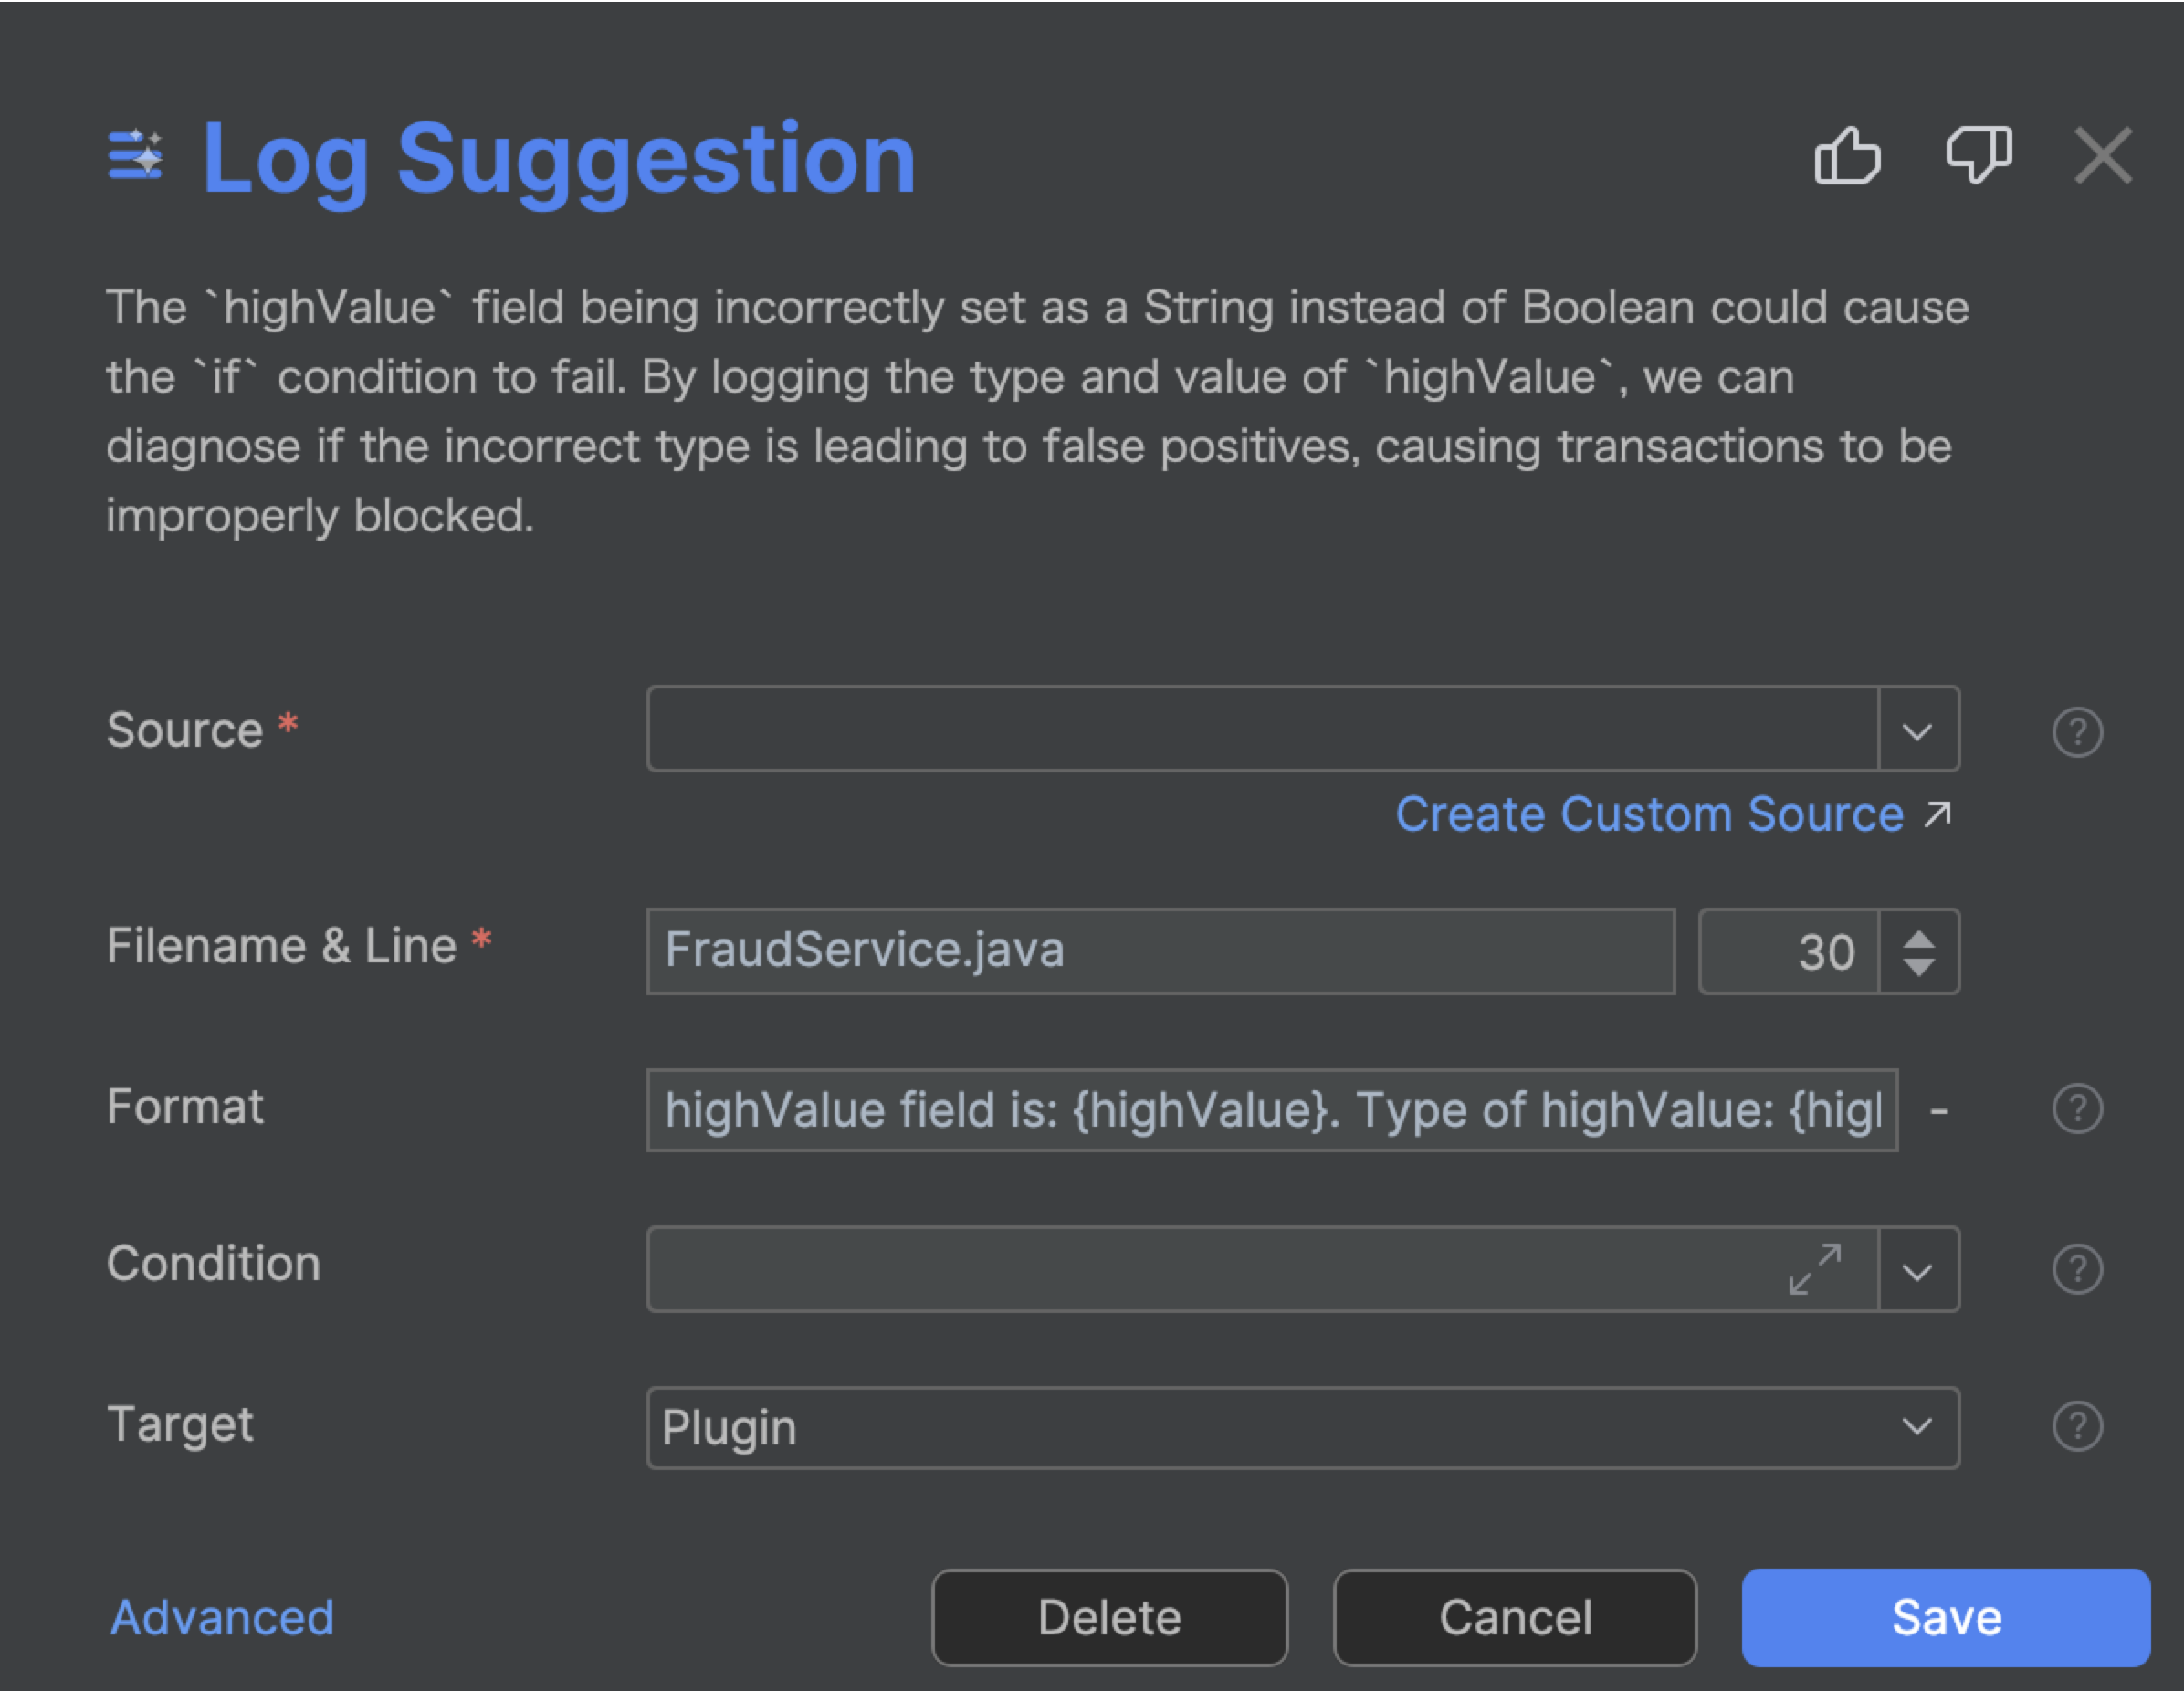
Click the relevant Lightrun action that is likely to resolve your issue. In the following example, the Log Suggestion has been selected.
The Log Suggestion dialog opens and the log details are populated with the relevant expressions to debug your issue.
-
Select the Source, adjust the settings as needed, and click Save.
Adding the suggested action replaces the icon with the standard Lightrun action icon.
Manage the Autonomous Debugger settings in the plugin🔗
The Autonomous Debugger is preconfigured with default settings—no changes are required to start debugging. You can optionally modify analysis, indexing and general settings based on your needs.
Reset the current session🔗
To reset the current debugging session, including the issue description and related suggestions.
-
In the AI Debugger tab, click the
icon.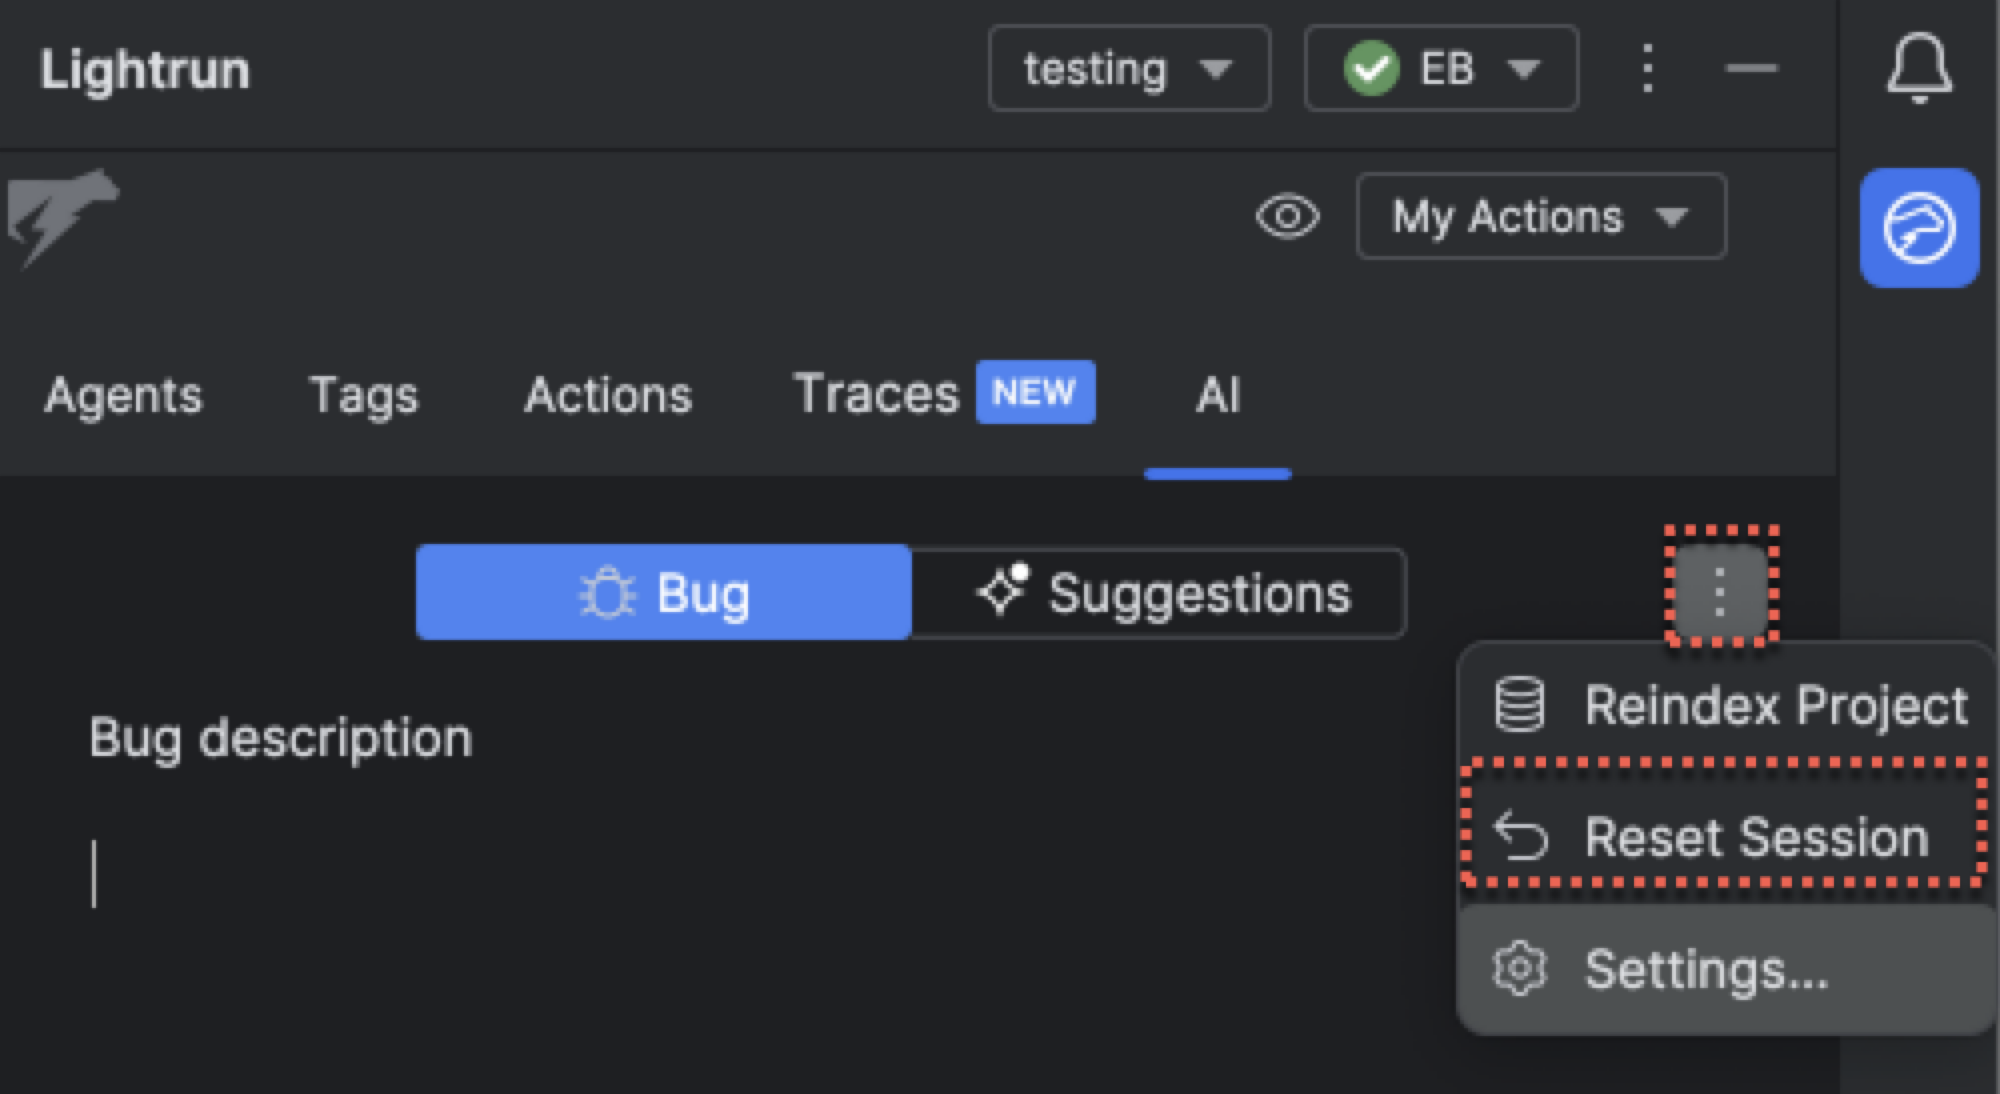
-
Click Reset Session. The session is cleared.
Modify issue analysis settings🔗
-
In the Settings dialog, select the Issue Analysis tab.
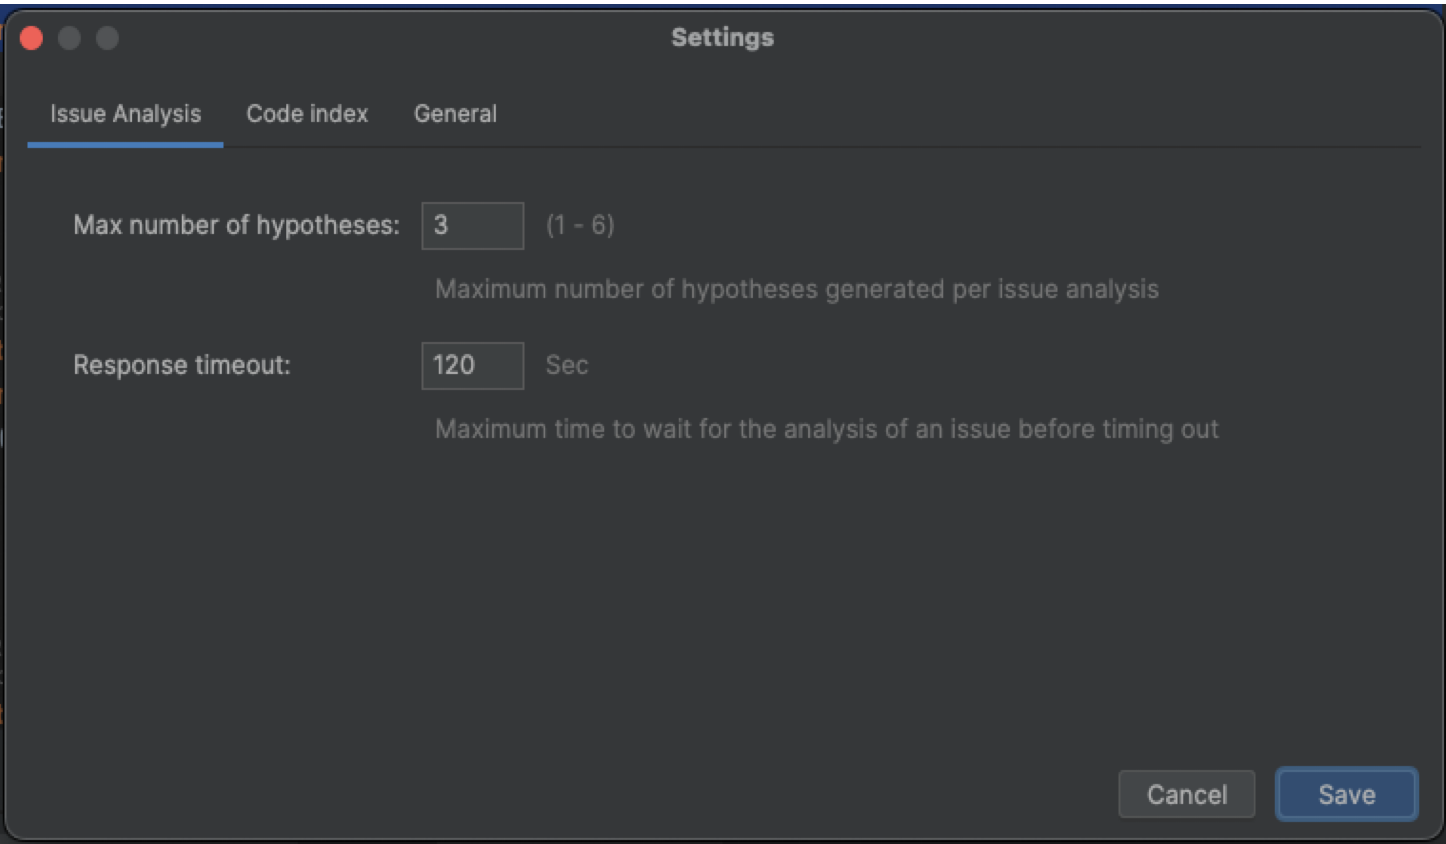
The Issue Analysis tab includes the following fields:
Setting Description Max number of hypotheses Specifies the maximum number of hypotheses the debugger can generate. Increasing this number uses more resources but increases the potential causes for the bug. The debugger may generate fewer hypotheses than the maximum number set. The default is set to 3 hypotheses. Response timeout Specifies the maximum time to wait for the analysis of an issue before timing out. The default is set to 120 seconds. -
Click Save to apply the changes.
Modify code indexing settings🔗
-
In the Settings dialog, select the Code Index tab.
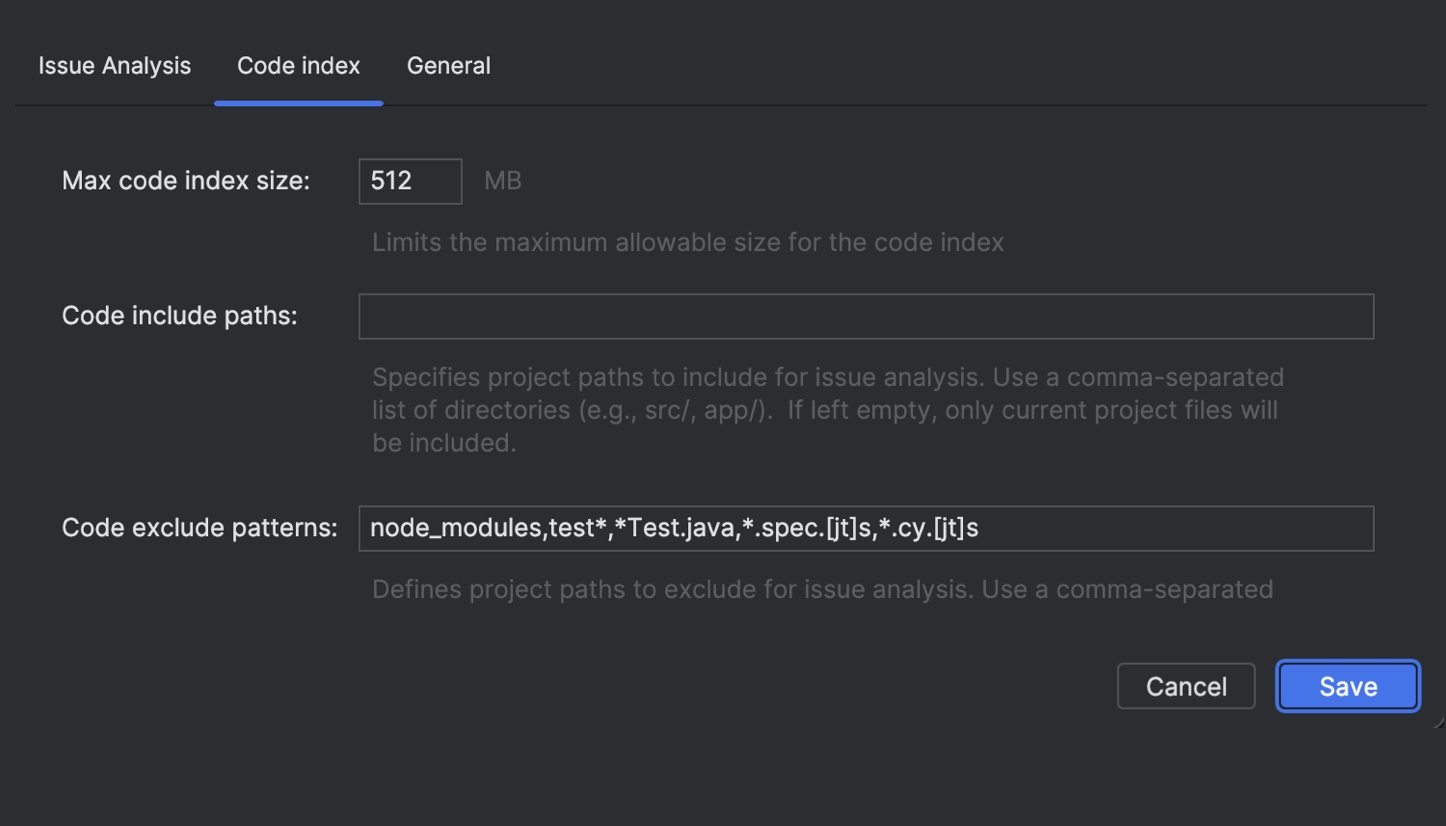
The Code Index tab includes the following fields:
Setting Description Max code index size 512 MB. Code include paths Add additional codebases (e.g., external dependencies or services) to the debugger's context. Absolute directory paths must be provided, and multiple paths can be separated by commas. Code exclude paths Ignore the files matching specified patterns when creating the initial debugger context. Supports glob expressions, such as:
•*.txt: Excludes all files ending with.txt.
•test: Excludes files in any directory namedtest, but does not exclude directories liketestsorunit_test.
•*test: Excludes the entireunit_testdirectory. -
Click Save to apply the changes.
Update the path to your Python interpreter🔗
The Python interpreter is a basic requirement for running the Autonomous Debugger. You can manually update the path to the Python interpreter as part of the setup process. For more information on specific Python requirements, see Autonomous Debugger System Requirements.
-
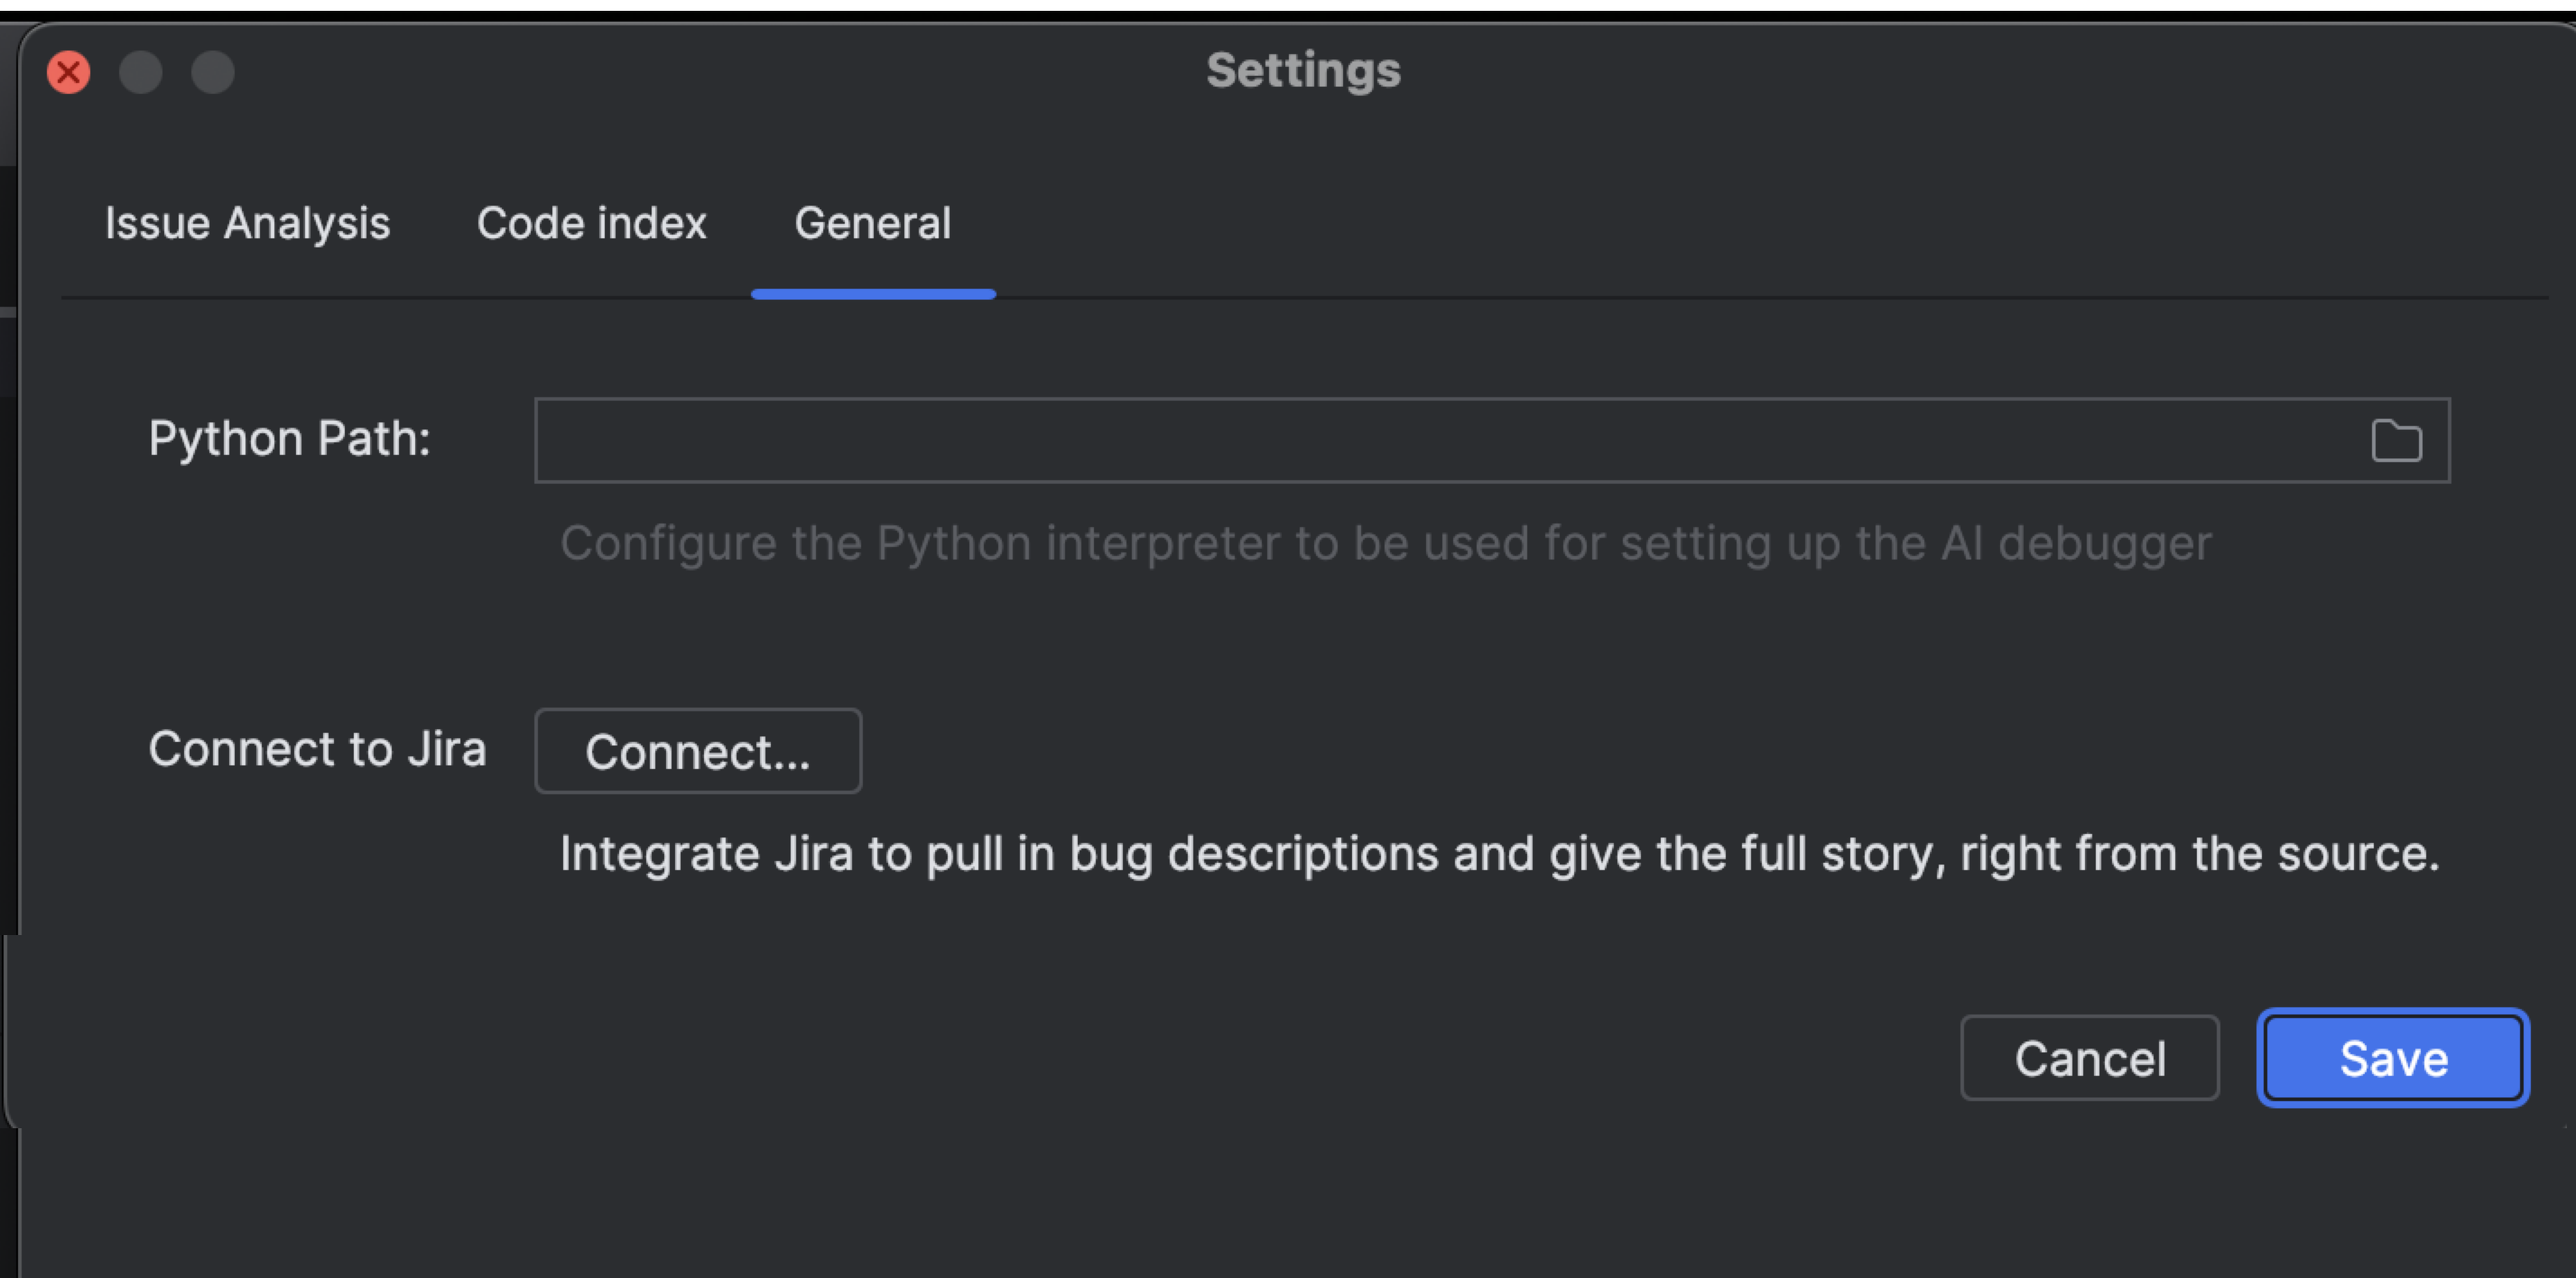
In the Settings dialog, select the General tab.
-
In the Python path field, enter the path to your Python interpreter.
- Click Save.
Set up the connection to Jira🔗
Connecting to Jira is supported starting from version 1.62. Data is transferred in a one-way, read-only pull from Jira.
You need to initially set up your connection to Jira prior to working with integration.
Prerequisites
-
Jira Connect Feature is enabled. Performed by Admin.
The Jira integration feature is required to be enabled in the Lightrun Management Portal. For more information, see Configure the Autonomous Debugger global settings for your organization.
- Ensure authentication is completed against your Jira instance in the Lightrun plugin.
-
set up the connection to Jira using one of the following methods:
- From the Settings > General tab.
1. In the Settings dialog, select the General tab.
2. In the Connect to Jira field, click Connect.
- From the Jira icon in the Bug tab.
1. In the JetBrains Lightrun plugin, click the AI Debugger tab.
2. Select the Bug tab and click the Jira icon on the bottom left of the plugin.
The Lightrun is requesting access to your Atlassian account dialog opens.
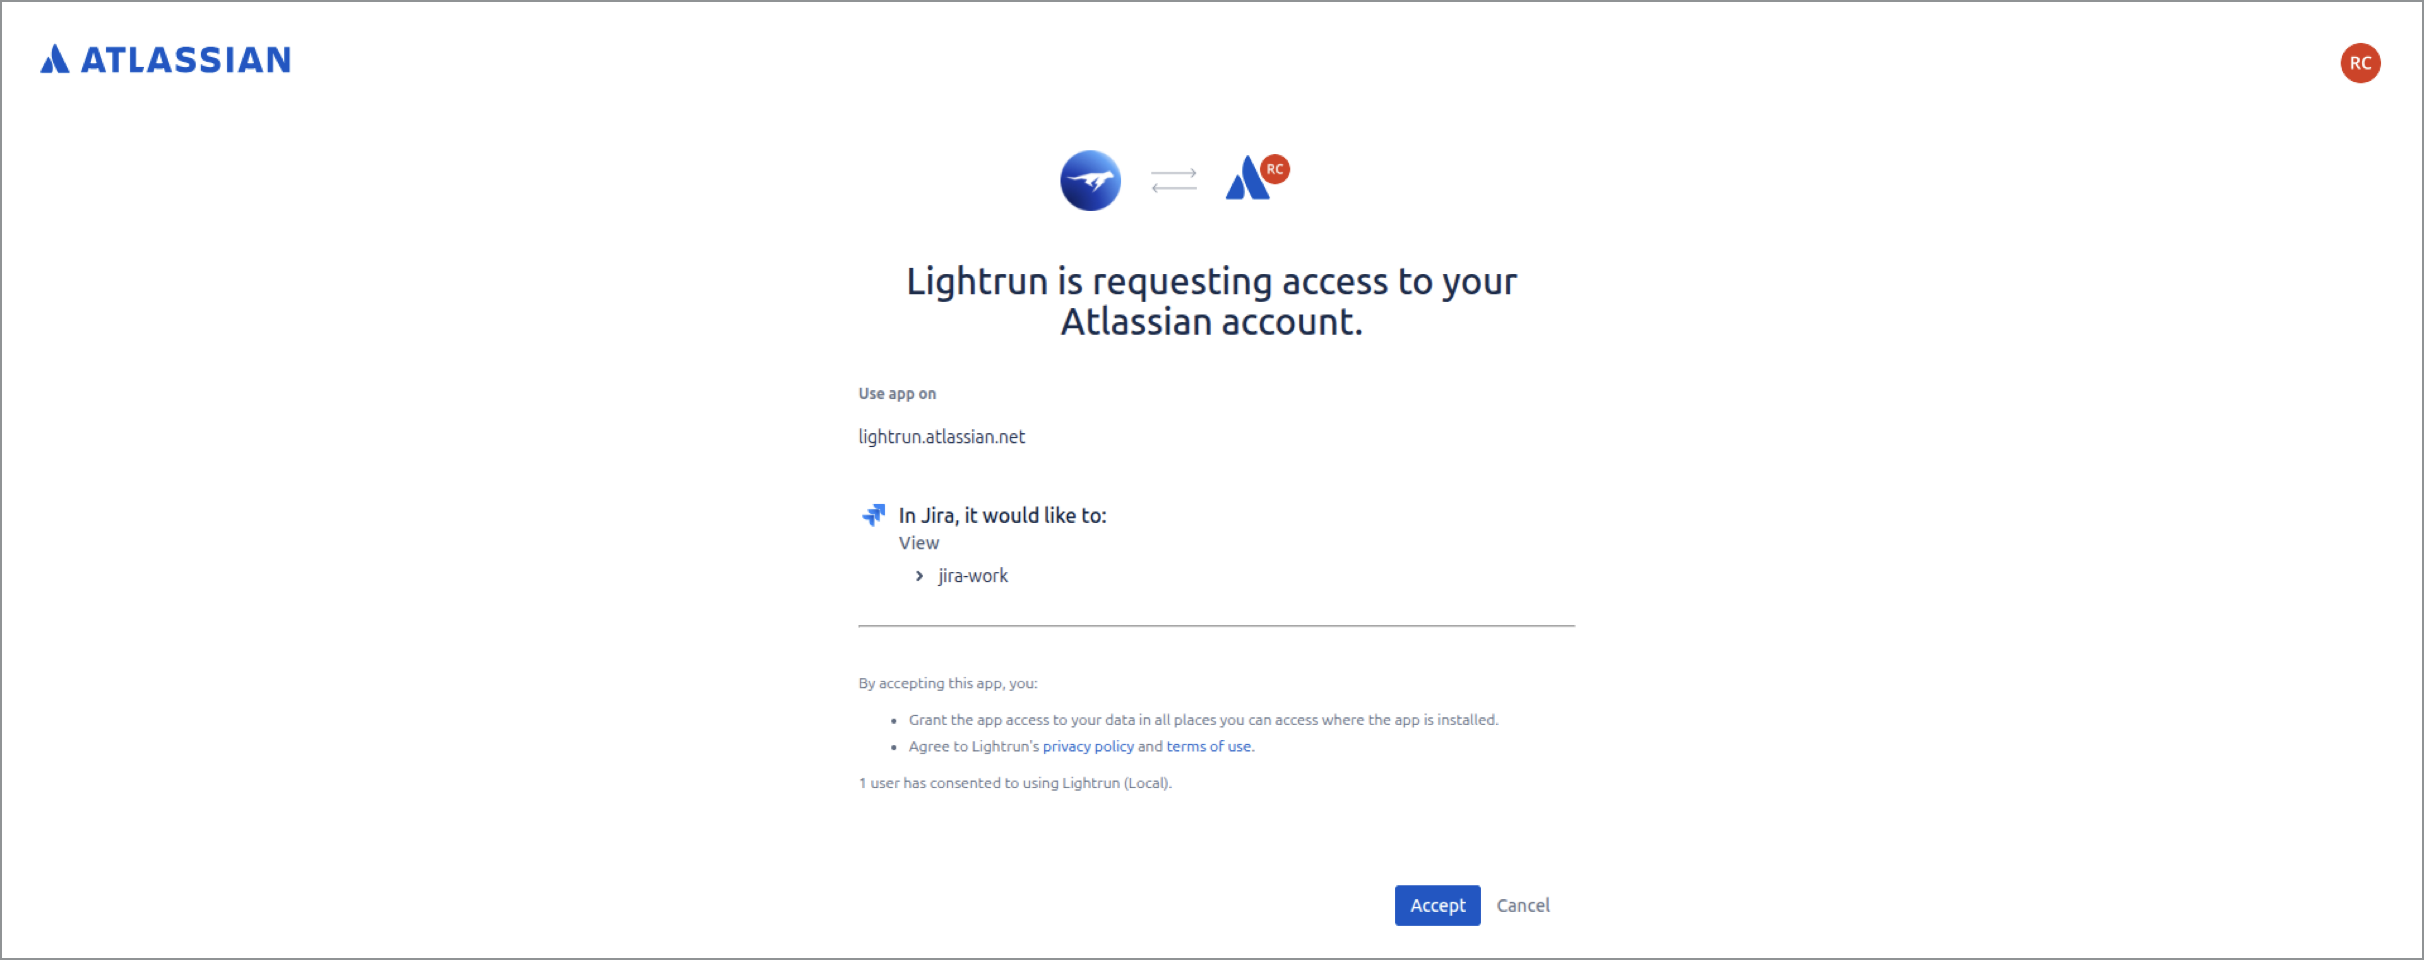
- From the Settings > General tab.
-
Click Accept.