Create a Dynamic Trace in the JetBrains IDE🔗
Dynamic Traces enable you to track specific runtime behaviors across application threads. The process involves both user-driven actions and automated stages managed by Lightrun. For a high level overview on working with Traces, see Work with Lightrun Dynamic Traces for Java in JetBrains.
Rules and guidelines when creating Traces🔗
The following guidelines apply to Traces:
- Traces are supported in JetBrains for the Java runtime.
- The Lightrun plugin, agent, and server must be ugraded to at least version 1.52.
- The scope of a Trace is limited to a single thread and cannot be applied across multiple threads.
- You can define Trace Snapshots in any class within the same request, as long as the request is processed by the same application thread. While you can add Context or Trace Snapshots to different classes, they must be part of the same thread.
- A Trace can have a maximum of 20 Trace Snapshots.
- Trace Snapshots can be triggered only when the Trace is active.
- A Trace Snapshot can only be associated with one Trace.
- Traces are not visible in the Lightrun Management Portal.
Prerequisites🔗
Ensure the Lightrun plugin is up and running:
- Install the 1.52 plugin version or higher in your local JetBrains instance.
- Authenticate JetBrains IDE with your Lightrun account.
- Attache at least one Lightrun Agent to your app.
- Open the source code file for the running application from the IDE.
The main steps for working with a Trace are:
- Add the Entry Point Trace Snapshot
- Add Trace Snapshots to the Trace
- Activate the Trace
To learn more, see the Understanding the Traces Workflow
In the following tutorial, we will show how to add a Trace to the PetClinic application.
Step 1: Insert the Trace Snapshot (Entry Point) to the code editor🔗
- Go to the line of your source code at which you'd like to insert the Trace Snapshot.
-
Right-click to open the context menu and select Lightrun > Trace Snapshot.
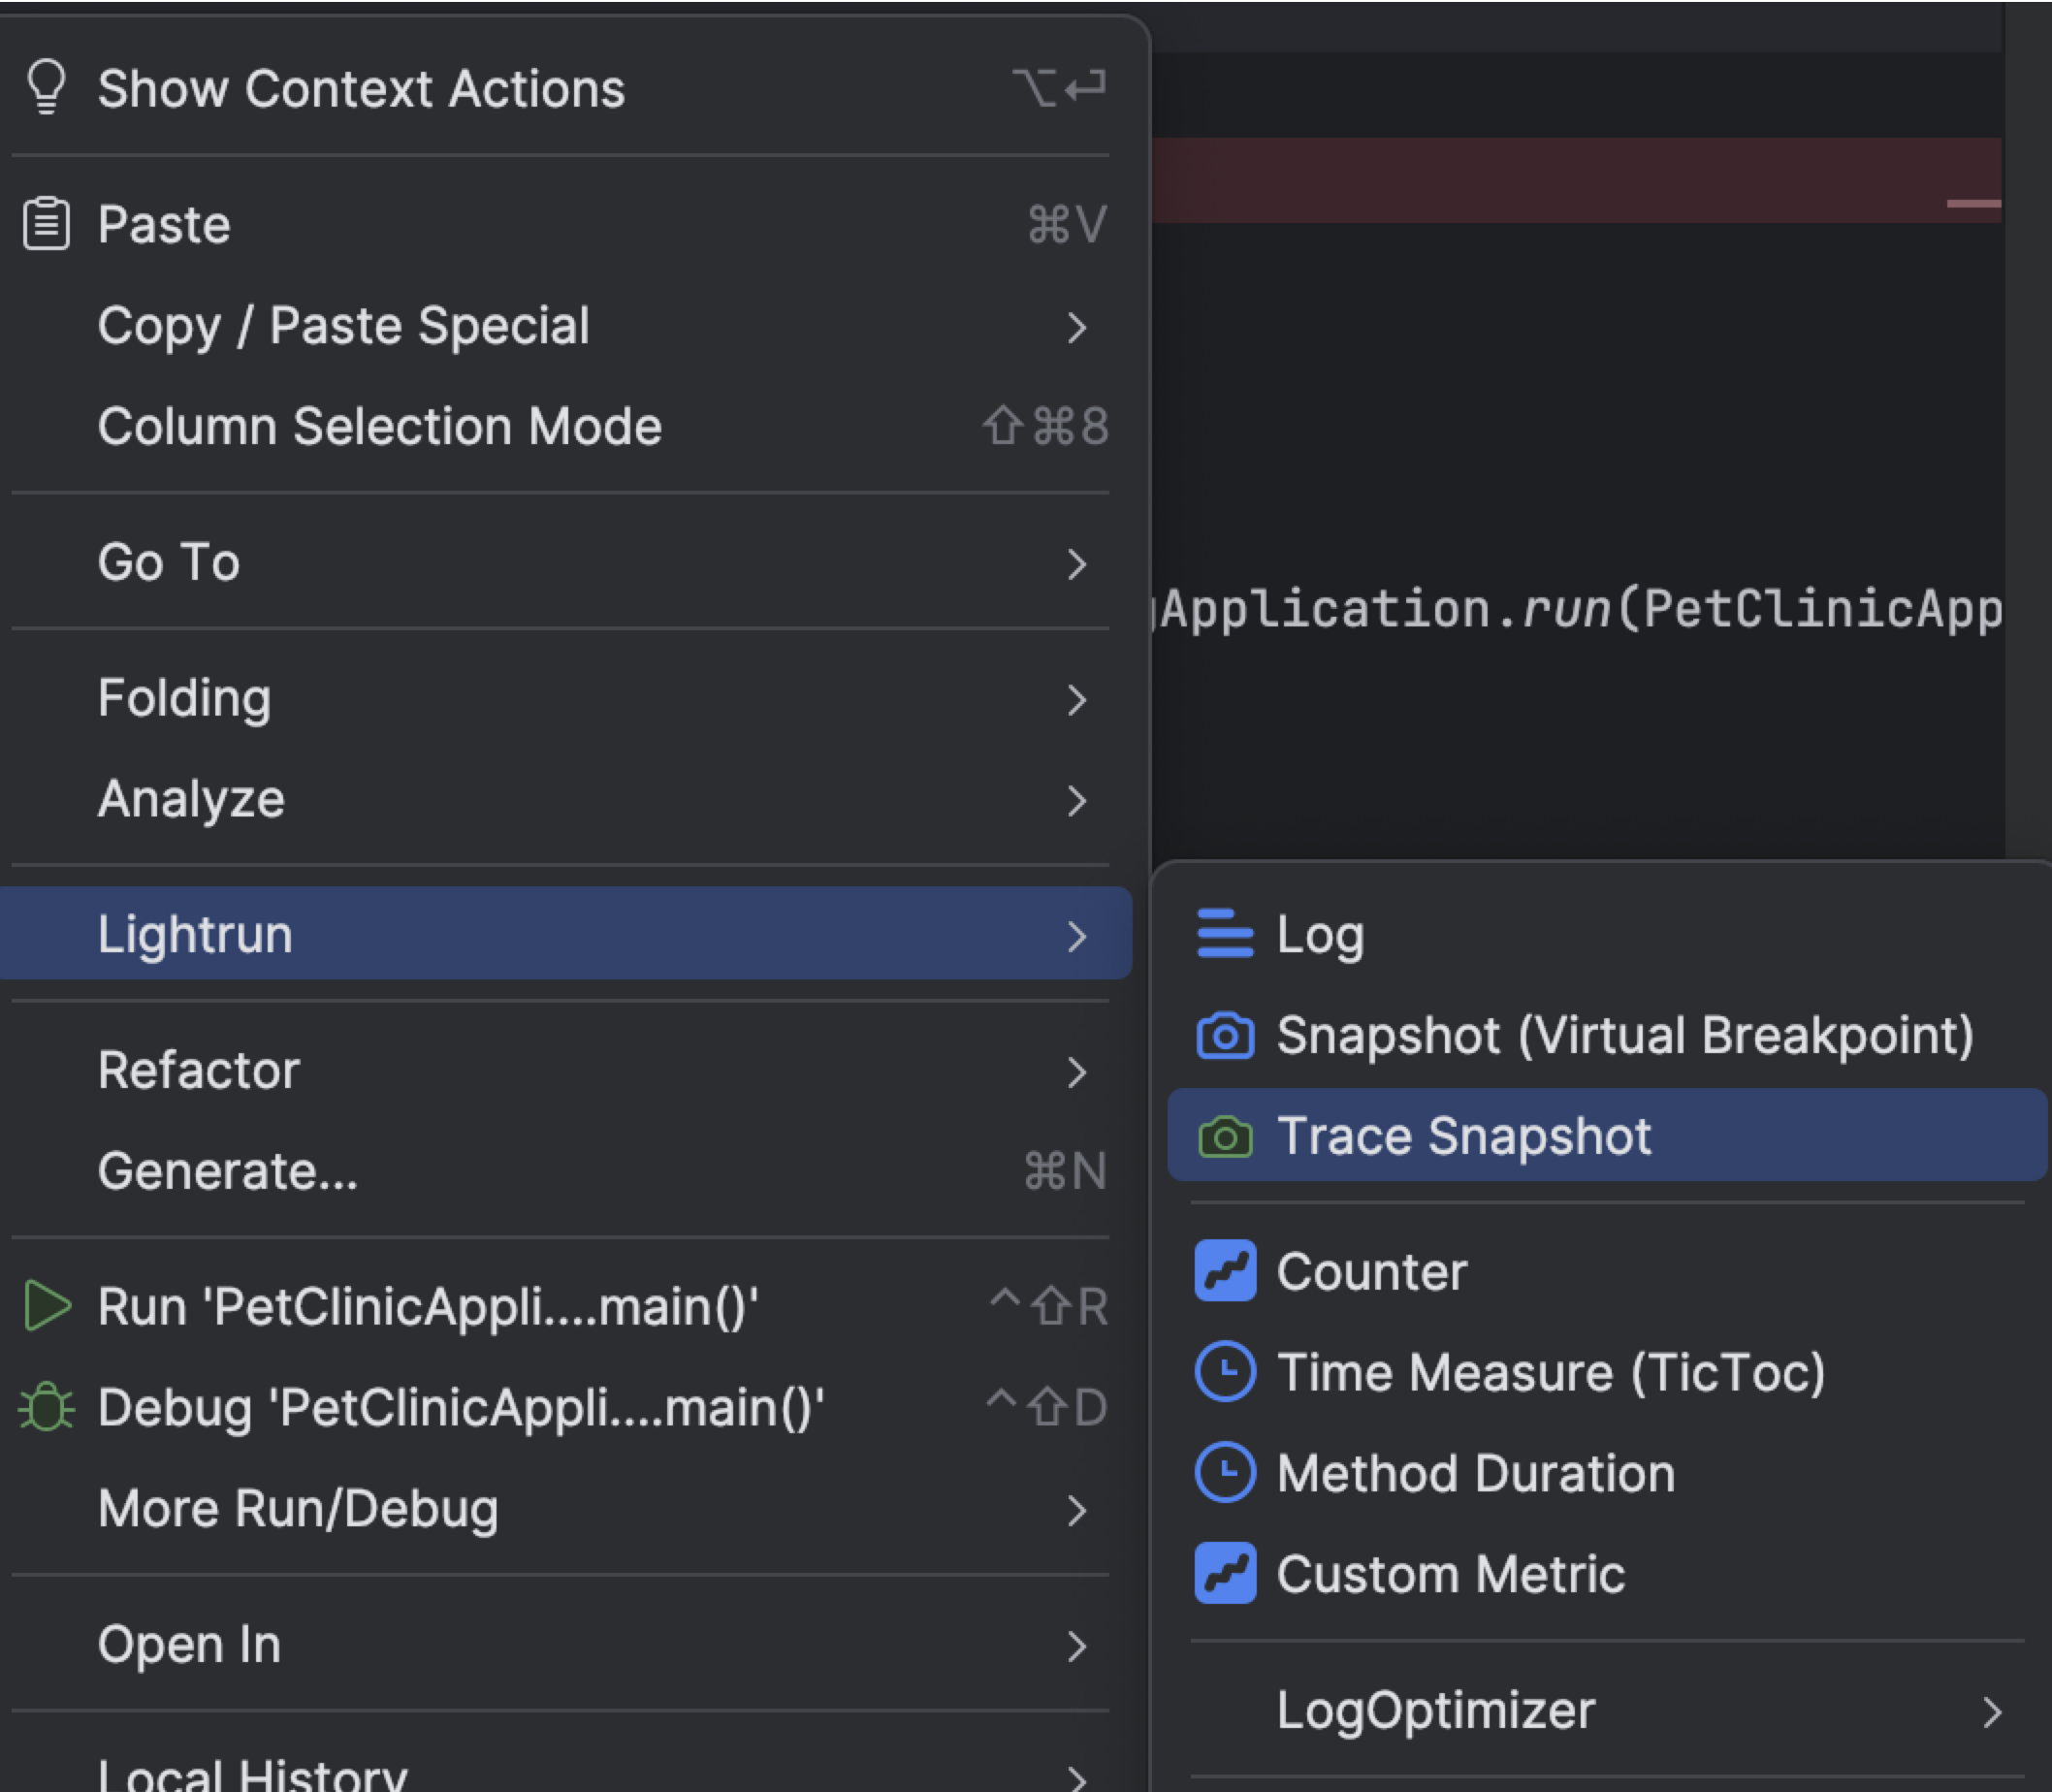
This initial Trace Snapshot serves as the Trace Entry Point, allowing you to name the Trace and define its Source for the entire Trace.
-
In the Trace field, enter a name for the Trace.
A dropdown will open displaying the name you provided and next to it Create as new.
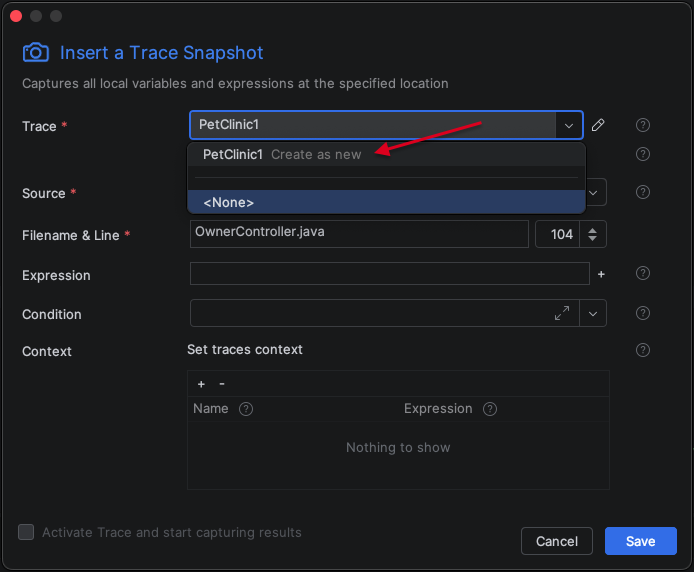
-
Click Create as new.
-
Click Save.
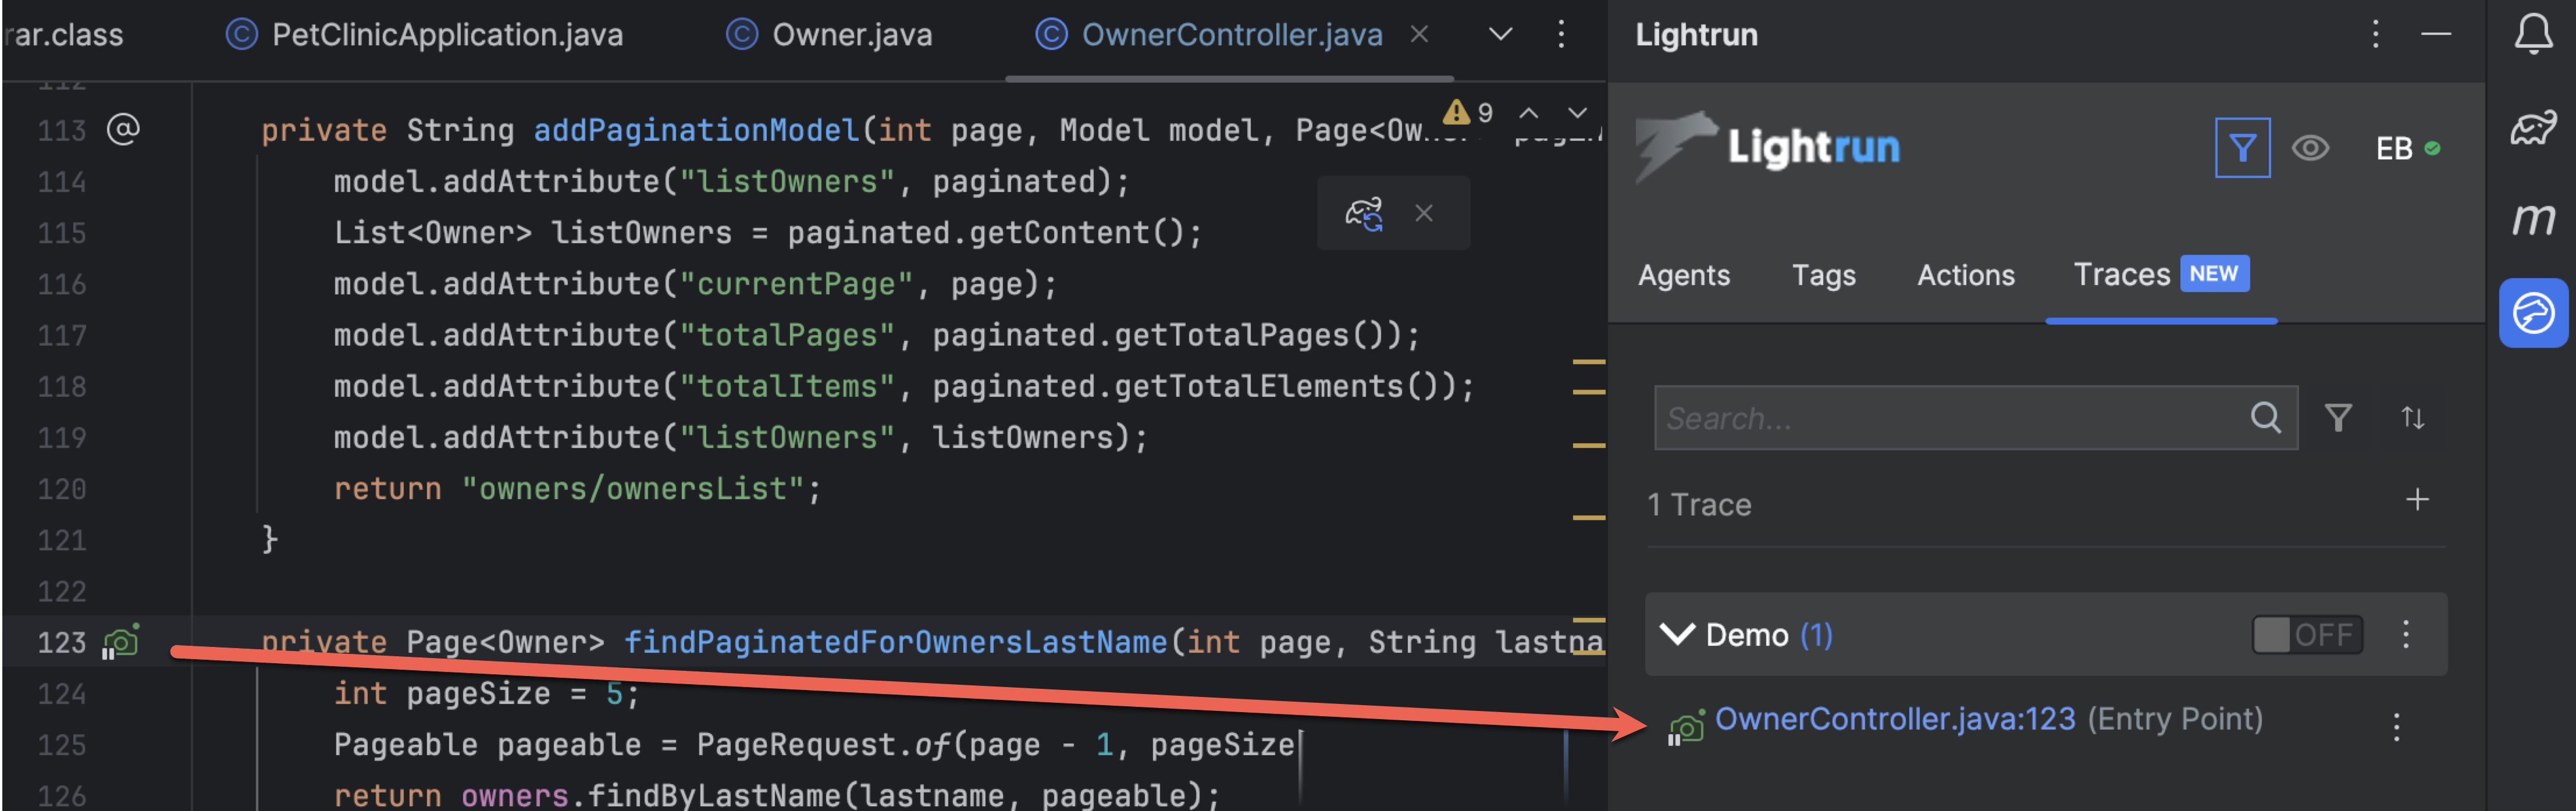
The Trace Snapshot is added to the code editor and the Trace entity is added to the Traces tab.
The default settings are:
Field Description Default Value Name Enter an intuitive name for the Trace. This field is mandatory. User-assigned Source From the list, bind the Trace to a specific agent, tag, or custom source. It applies to all the snapshots in the Trace, so you don’t need to select it for each snapshot added. This field is mandatory. Select from a predefined list. Max results Allows you to limit Trace capturing by specifying the maximum number of Trace results to capture. 10 Advanced section Max snapshot hits Allows you to limit Trace capturing by setting the maximum number of snapshot hits that can occur within the Trace instance. This is aggregated for all snapshots in the Trace. Starting from version 1.73, the default has been raised to 20 hits. 20 Expire after The period of time after which the Trace will no longer be active. When you click Activate, the clock starts ticking. 10 (Min.) Termination timeout The period of time after which the Trace instance will expire. 30 (Sec.) Ignore quota Allows you to bypass Trace quotas set for the agent or system, enabling unlimited Trace captures for this specific Trace instance. Unchecked
Step 2: Insert additional Trace Snapshots🔗
Add Trace Snapshots directly to the source code and assign them to the Trace name created earlier. The Source will be inherited from the Trace and therefore disabled by default.
- Go to the line of your source code at which you'd like to insert the Trace Snapshot.
-
Right-click to open the context menu and select Lightrun > Trace Snapshot.
-
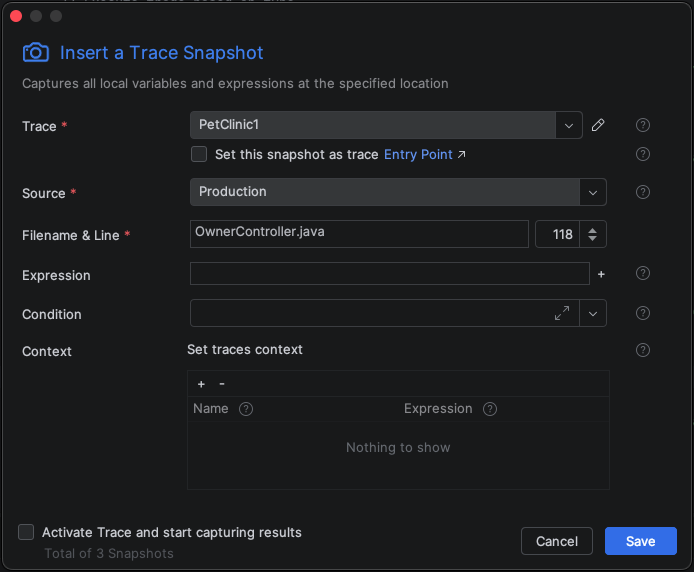
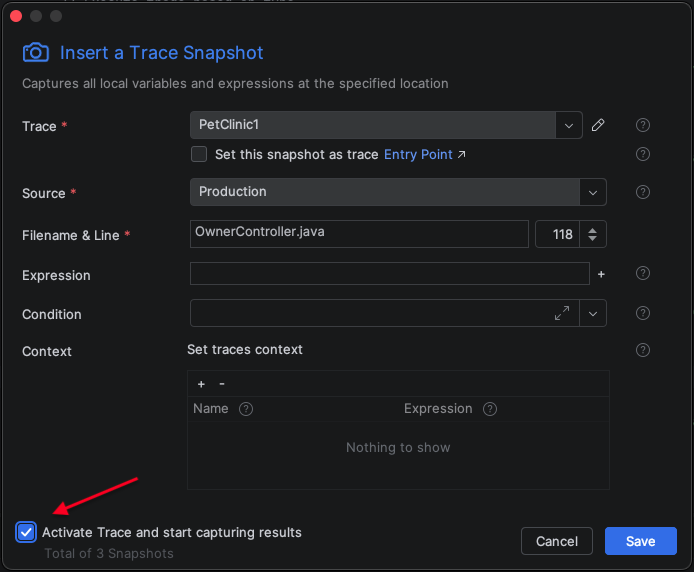
Enter the Trace Snapshot settings.
Field Description Filename & Line The source code file and line of code into which you're inserting the snapshot. The default path is to the source code file from which you're currently working. Expression Variables or method results to be displayed in the Trace Snapshot stack. Click + to enter additional expressions. Condition The condition of an ifstatement, used to limit the execution of the action. For example, the conditionmyVar % 7 == 0limits the output to variables divisible by 7. -
In the Context section, define the context expression that will apply to all the Trace Snapshots in the Trace. Note that if there is a conflict between expressions added to the Trace Snapshots within the Trace, the last context definition will take precedence.
Guidelines for setting Context
- The syntax of a Context is:
LR.ctx(“context-item-name”). - If there is a conflict between expressions added to the Trace Snapshots within the Trace, the last context definition will take precedence.
- You cannot define context in entry point conditions or expressions.
- The syntax of a Context is:
-
Click Save.
A dedicated Trace icon is added to the gutter. It is displayed with a pause symbol
 , indicating that the Trace is not activated yet.
 -
Repeat this step to add additional Traces Snapshots to the Trace.
Subsequent Trace Snapshots added will automatically be included as Trace members as displayed.
Proceed to activate the Trace.
Step 3: Activate the Trace🔗
Once you added all the Snapshots to the Trace, you need to activate the Trace, for the agents to start capturing the instances. You can activate it within the Lightrun plugin or from within a Trace Snapshot.
Activate the Trace from within the Snapshot🔗
The easiest way to activate a Trace is to check Activate Trace and start capturing results when saving the final Snapshot. This both adds the Snapshot to the Trace and activates it.
Activate the Trace from the Traces tab🔗
Alternately, you can activate the trace from the Traces panel in the Lightrun Plugin.
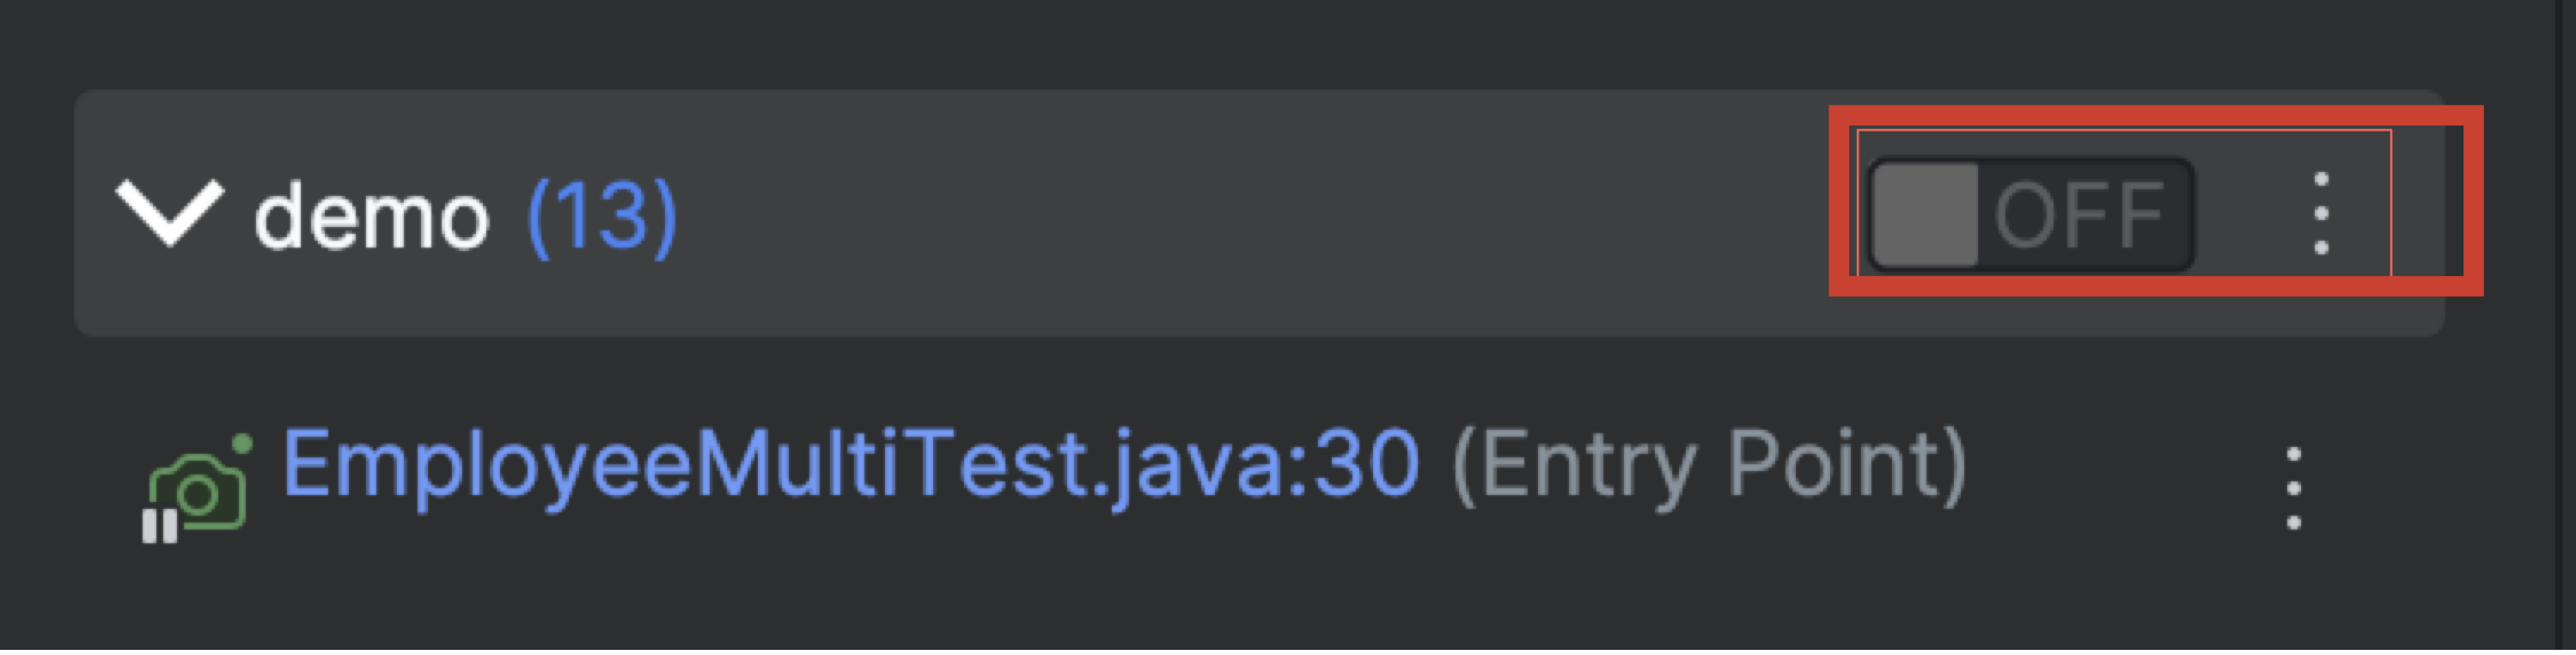
The initial state of a Trace is set to OFF.
- Go to the Traces tab in the Lightrun plugin
-
Click ON.
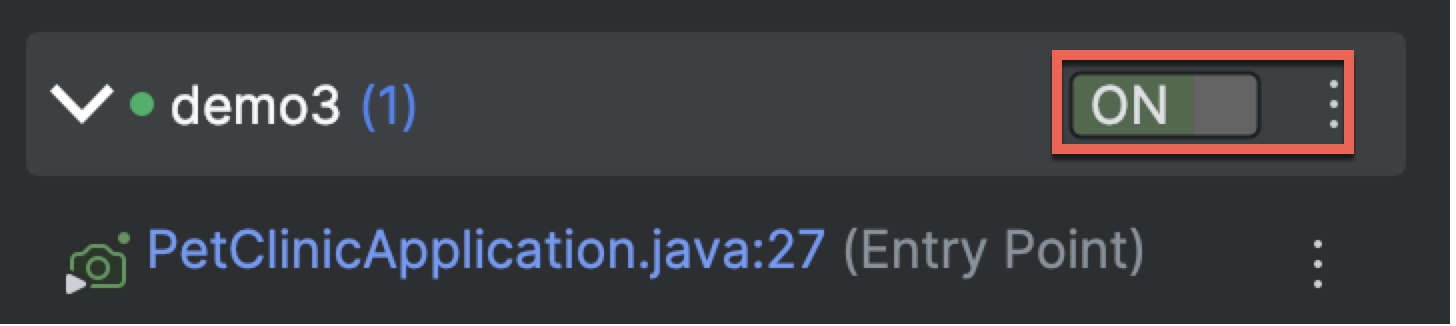
When set to ON, any execution thread reaching this Trace’s entry point will trigger a new instance of the Trace. The following occurs:
- A Green bullet is displayed next to the Trace.
- The Trace Snapshot icon changes from pause to run.
-
Click the dropdown to see that the Trace Snapshots were accepted by the agent.

Note that Trace parameters and associated snapshots cannot be edited.
-
Run your application and generate Trace Snapshot hits.
Next steps🔗
- Proceed to analyze the Trace results. For more information, see Analyze Trace Results.
- To manage Traces, for options on how to edit, delete, or modify a Trace or Trace Snapshots, see Manage Traces.