Integrate Lightrun with Prometheus🔗
Required Roles
| Up to version 1.69 inclusive | From version 1.70.4 and higher |
|---|---|
ROLE_MANAGER | Company Admin |
Prometheus is an open-source monitoring and alerting toolkit that scrapes and stores time series data locally from its configured targets (such as Lightrun) and then runs rules over the data for aggregation, recording, and alerting.
Prometheus offers multiple data visualization and alert configurations modes, including via additional tools such as Grafana, which can be very useful for visualizing Lightrun output data.
Prerequisites🔗
- Install and configure Prometheus. Refer to the Prometheus FAQ as well for additional help.
- From Lightrun version 1.23, you can generate a dedicated API Key to be added to the Prometheus JSON. For more information, see Lightrun API Keys.
-
For Lightrun to send observability data to your integrations, ensure:
- The application has a running agent attached to it.
- Your action Target is set to Promethues.
Enable and disable Prometheus integration🔗
-
Open a browser and log in to your Lightrun account.
-
In the menu on the left, click Integrations.
The page loads with all available integrations:
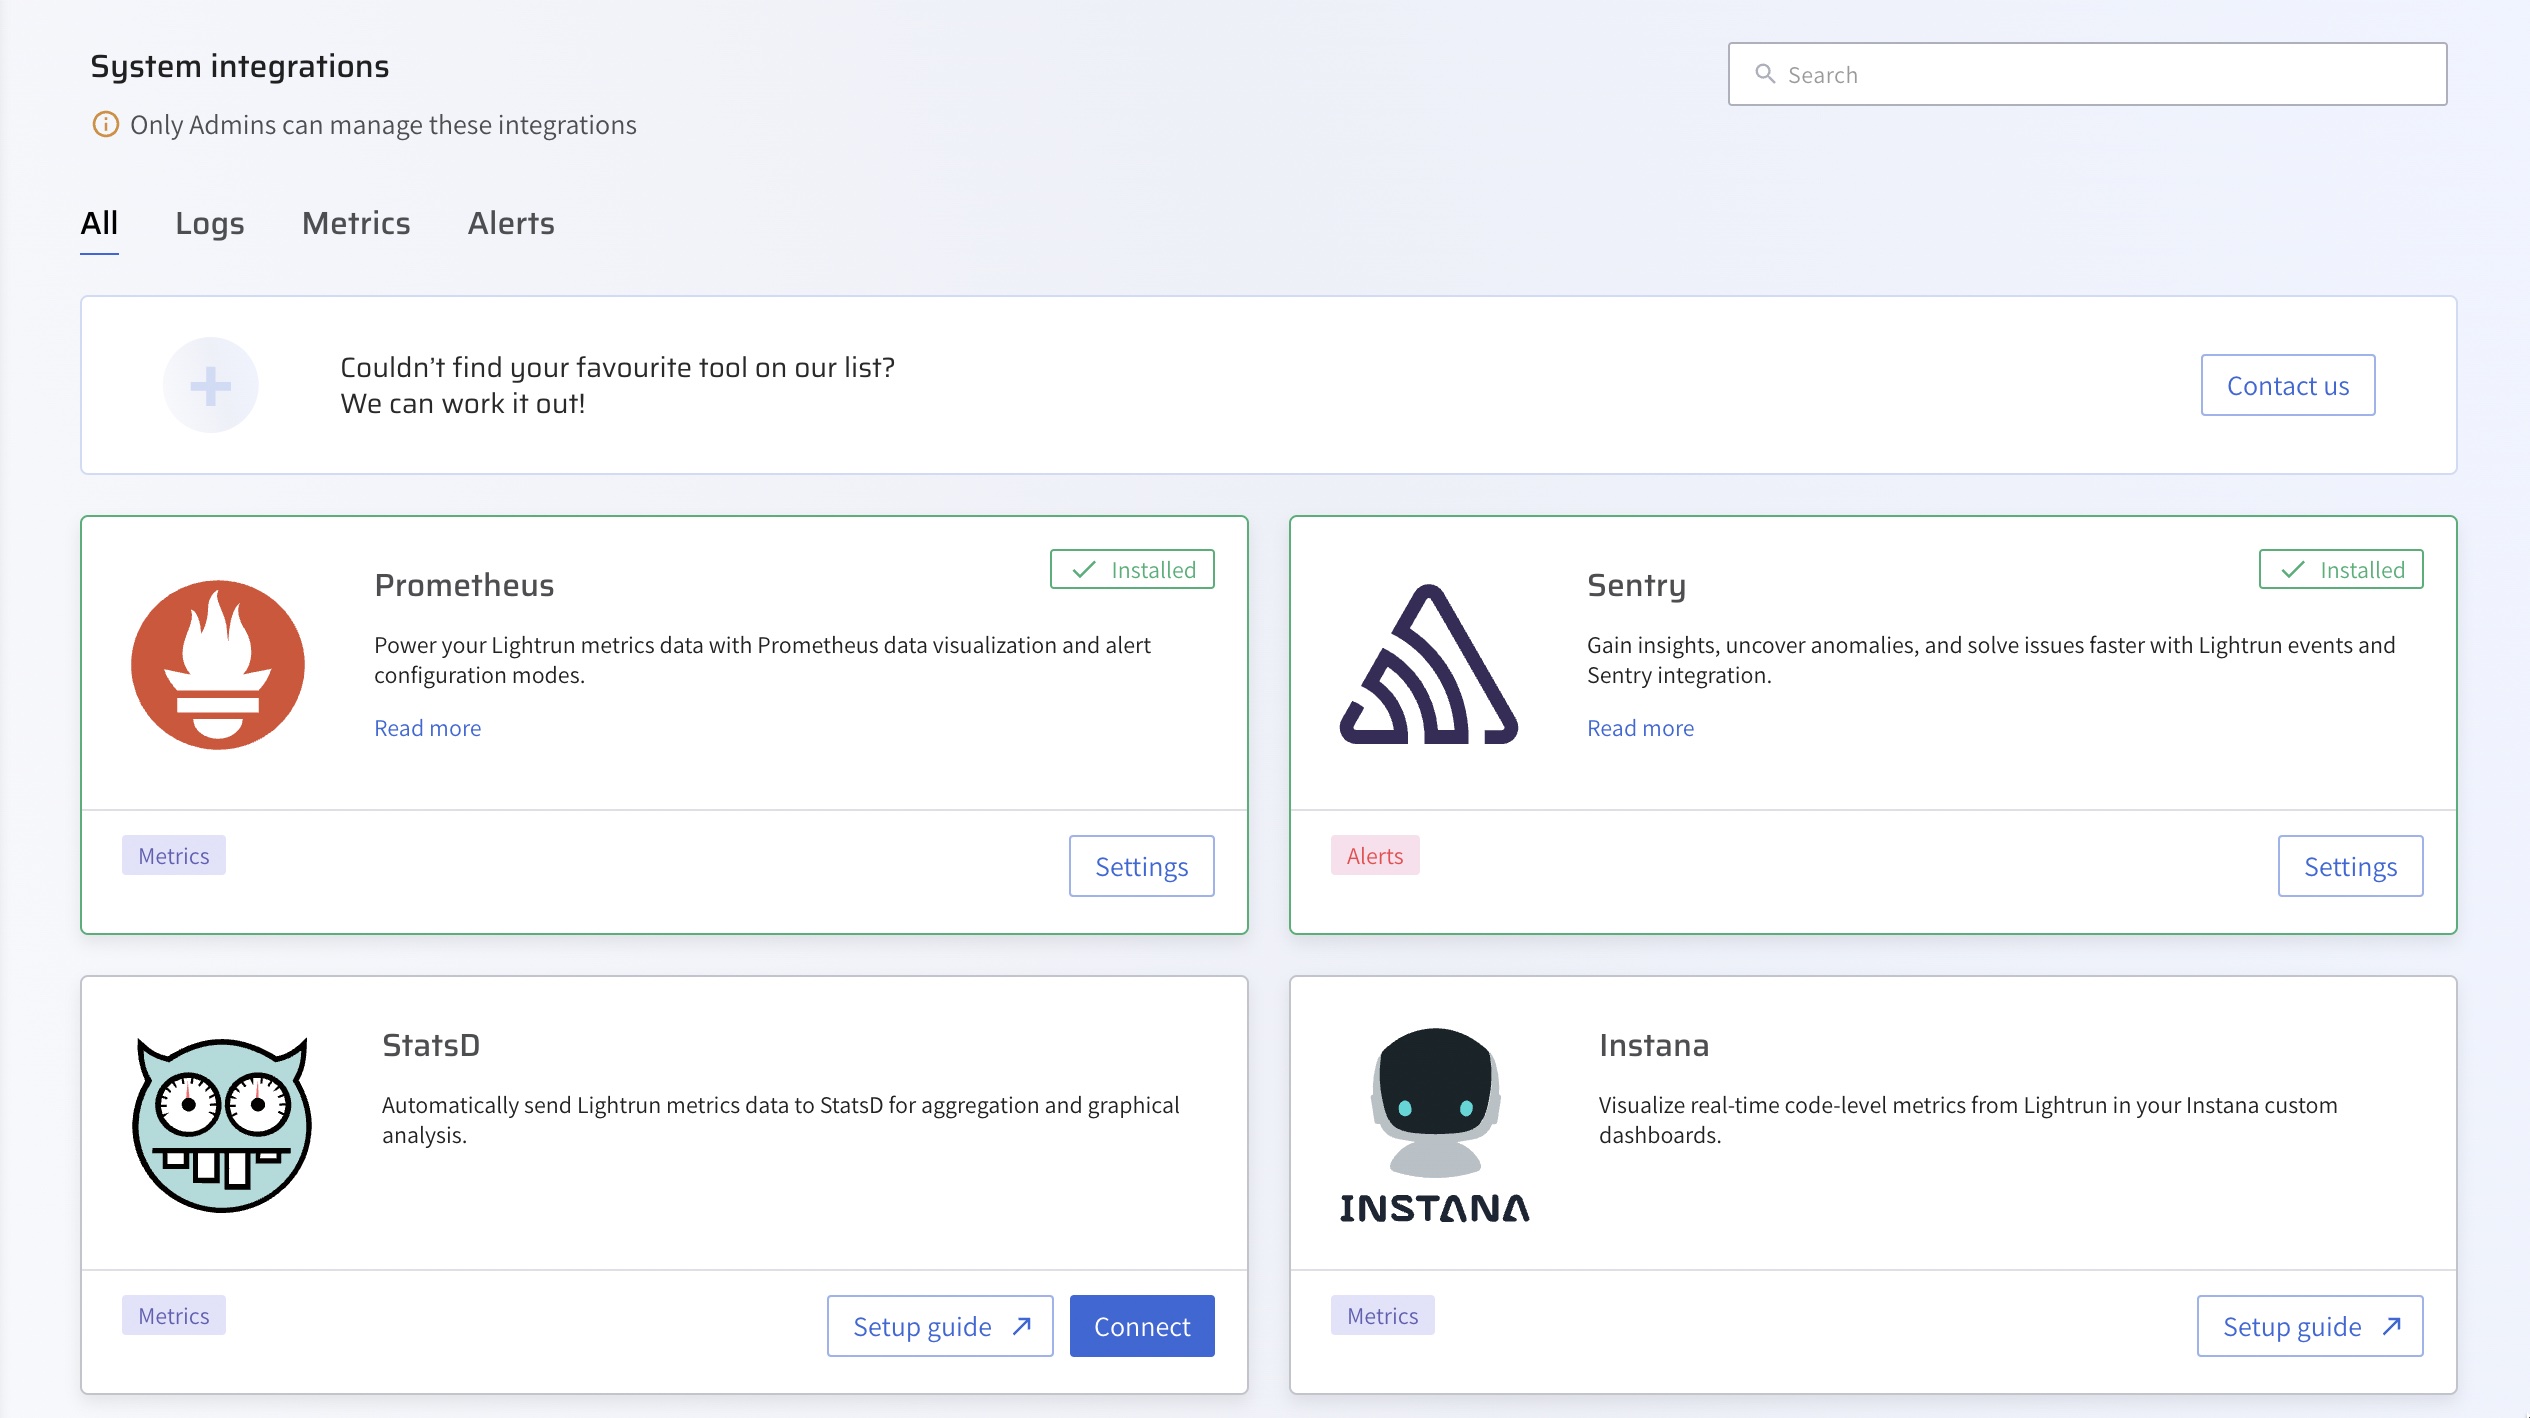
-
From the Integrations page, click Connect from the Prometheus card.
The Prometheus Integration window pops up:
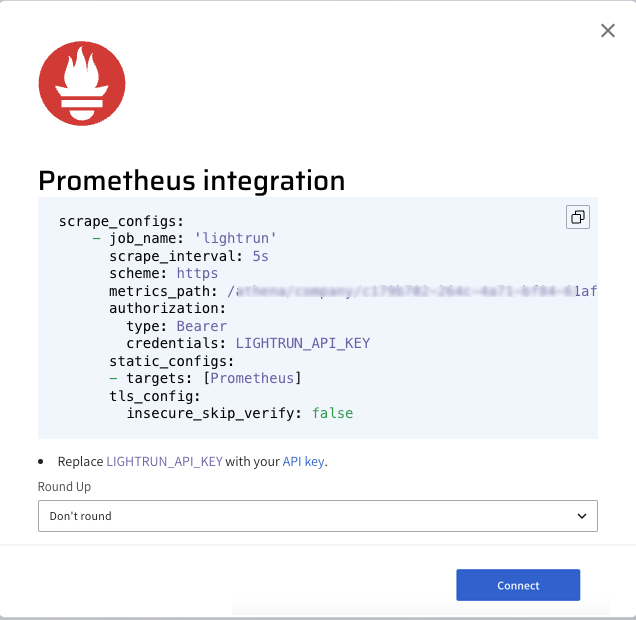
-
Click Copy from under the scrape configuration.
-
Paste the
scrape_configsdata to the existingscrape_configssection in your Prometheus YAML configuration file.
-
From the Round Up dropdown list, select the rounding rule to be applied by Prometheus for your Lightrun data. For more information, see round () parameter.
-
Click Connect and wait for the approval toast message.
-
To disable the configuration, click Disconnect.
Confirm your Prometheus integration🔗
If your Prometheus integration was successful:
-
The Prometheus card Connect button should change to Settings on your Management Portal Integrations page, and Installed should appear on the top left part of the card.
-
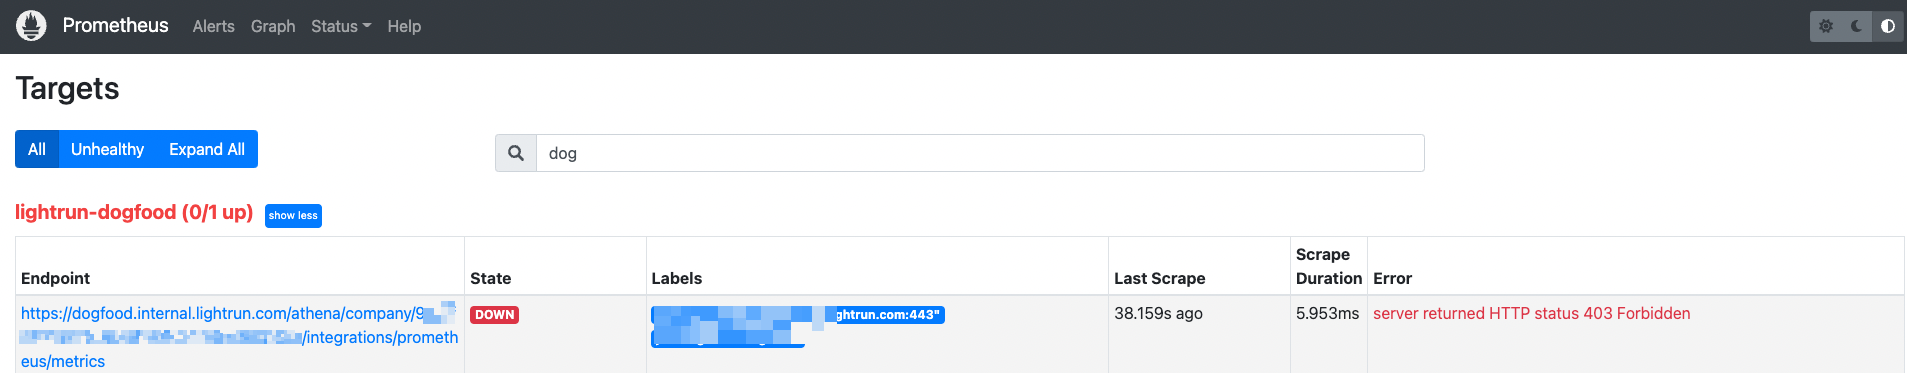
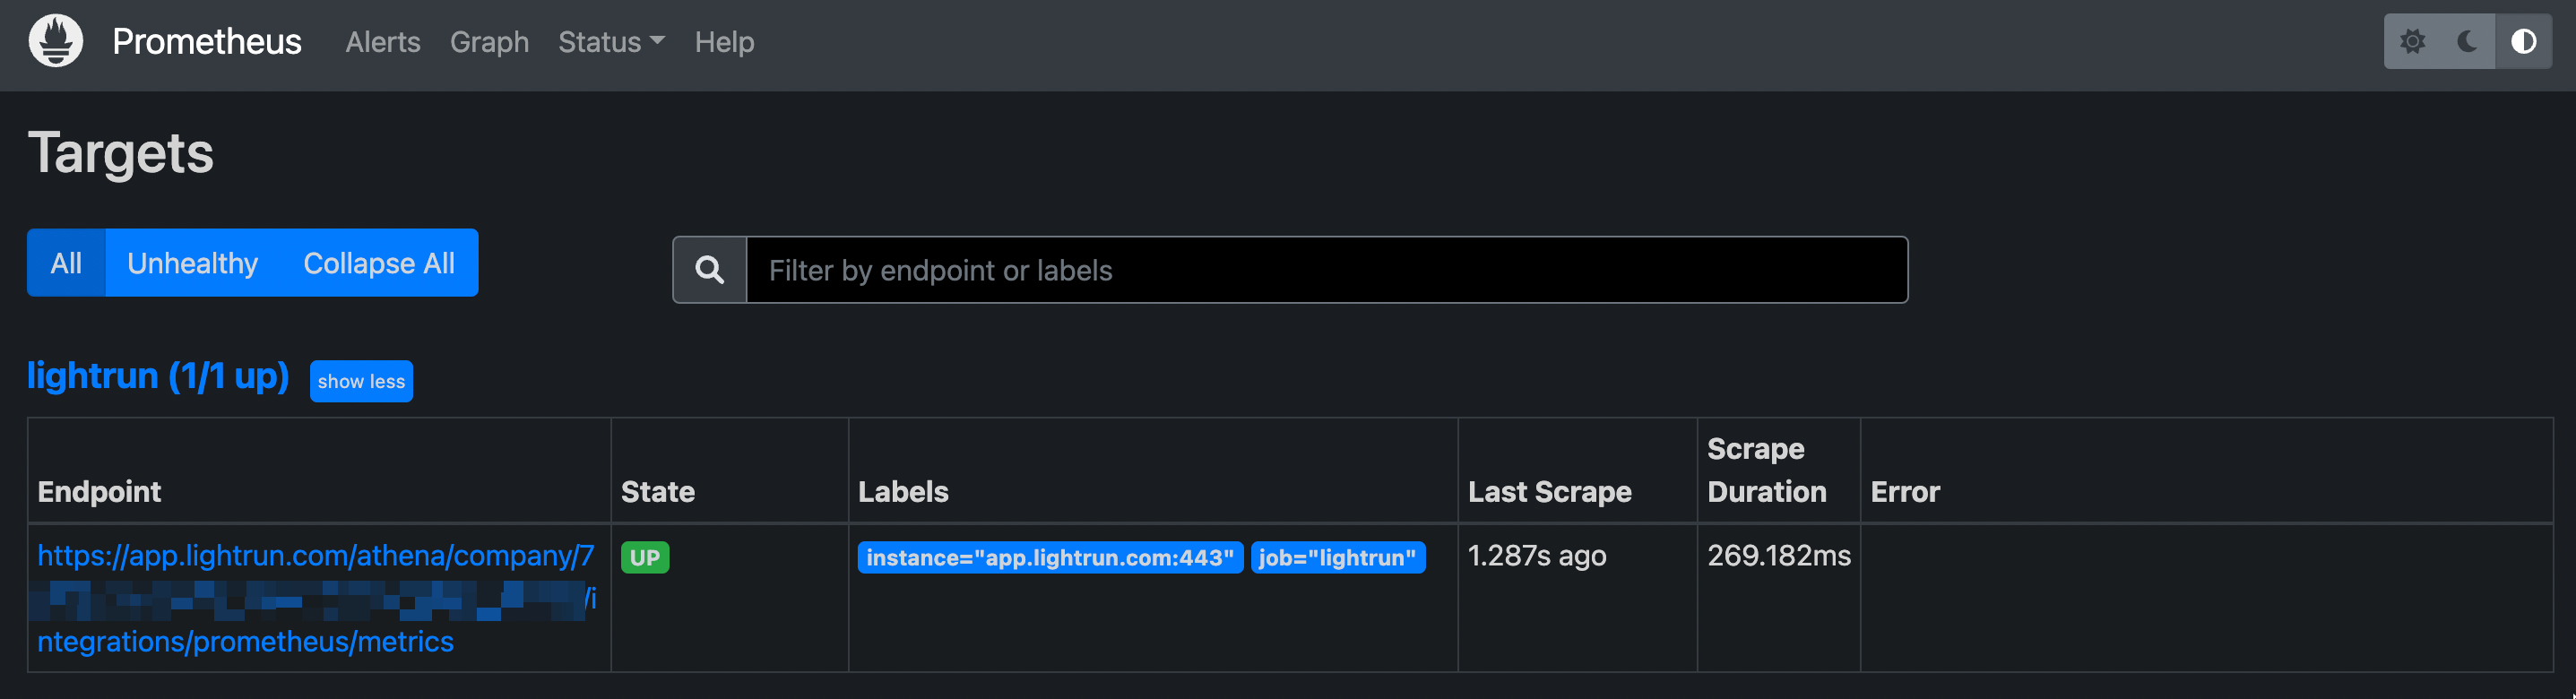
Lightrun should appear in your Prometheus interface Targets page, and the connection state should be Up.
Troubleshooting Prometheus integration🔗
-
If the connection state is down, confirm that:
- Your firewall rules are not blocking Prometheus queries to the Lightrun server.
- There are no communication issues with your Prometheus server.
- If the connection state is down and there is a
server returned HTTP status 403 forbiddenerror message. This error indicates that Prometheus integration is not currently enabled in your Management Portal.