Integrate Lightrun metric data into New Relic using Prometheus remote_write🔗
In this guide, you will learn how to ingest Lightrun metrics data into New Relic from a Prometheus time series database with the Prometheus remote_write capabilities.
New Relic is a cloud-based all-in-one observability platform that monitors performance and availability. By storing Lightrun metrics with Prometheus and ingesting the stored data into New Relic with Prometheus remote_write, you can analyze real-time metrics (counter, tic toc, custom metrics) collected from your live code using Lightrun with New Relic's advanced monitoring capabilities.
Prerequisites🔗
This tutorial assumes that you have:
- A Lightrun account.
- A New Relic account. Register for a free New Relic account here.
- Prometheus installed and running. Refer to the Prometheus FAQ as well for additional help.
- Basic understanding of Prometheus concepts and terminologies.
Configure the Lightrun Prometheus integration🔗
The first step in the tutorial will be to activate the Lightrun Prometheus integration.
To do that:
-
Open a browser and log in to your Lightrun account.
-
In the menu on the left, click Integrations.
The page loads with all available integrations:
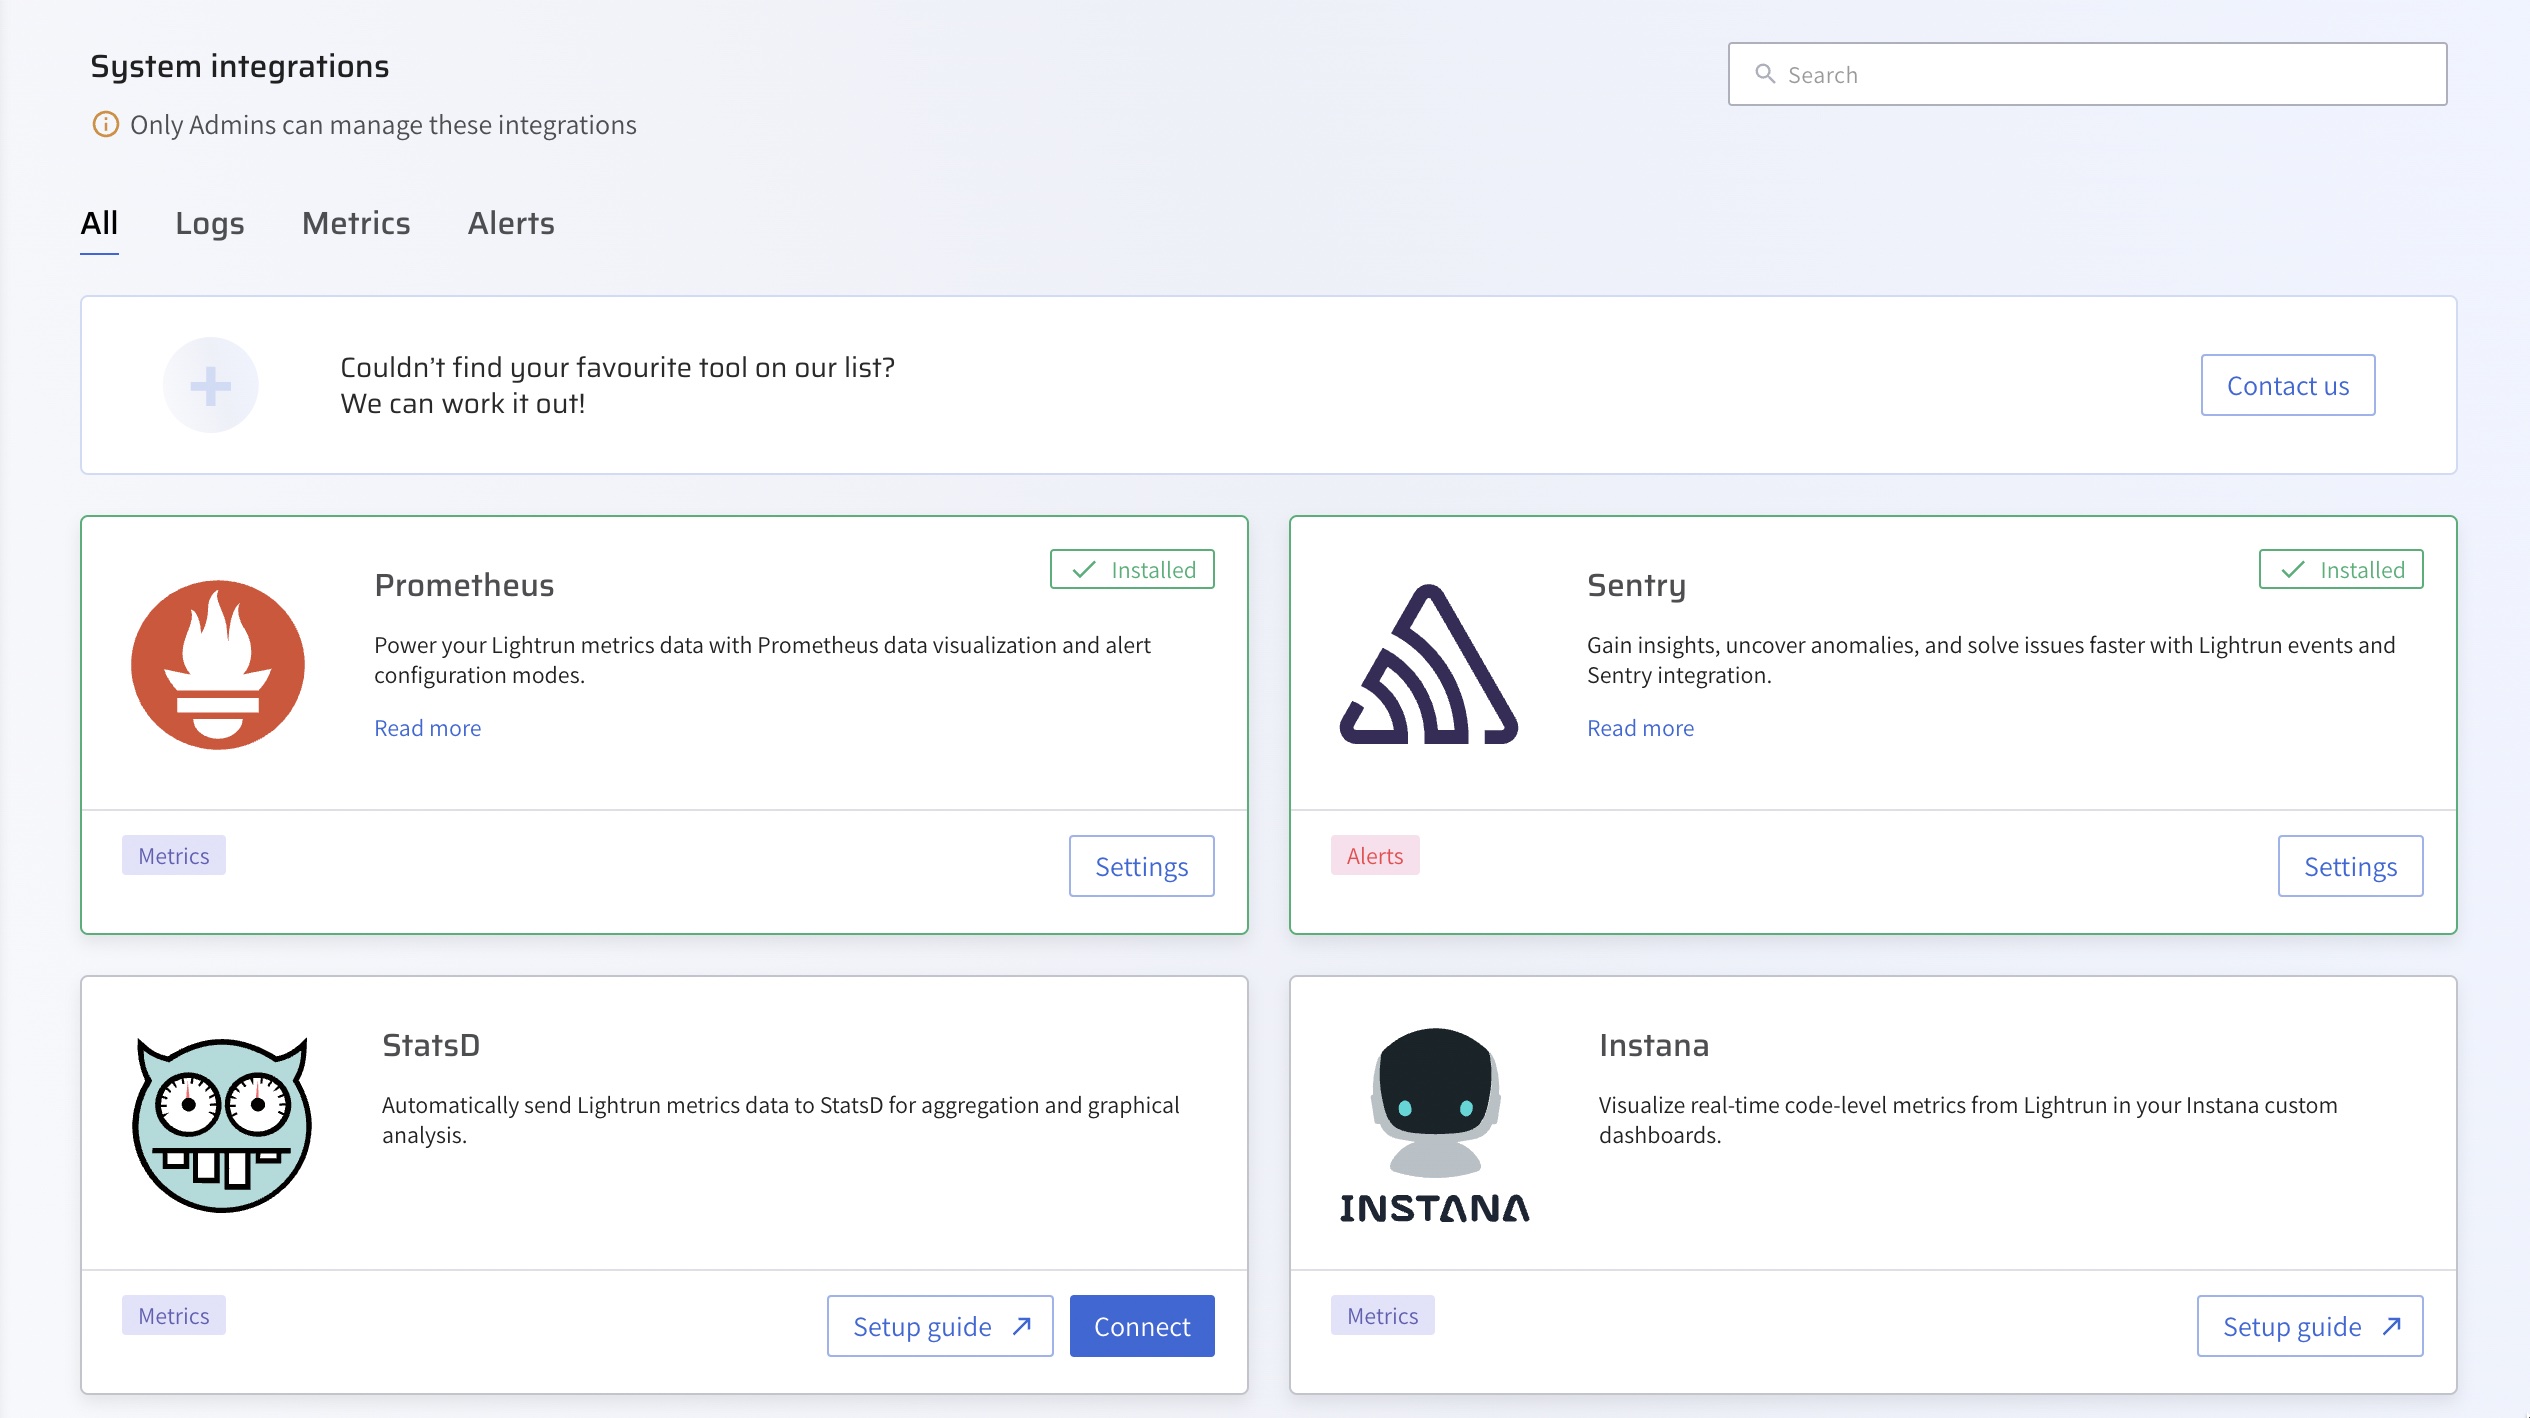
-
From the Integrations page, click Connect from the Prometheus card.
The Prometheus Integration window pops up:
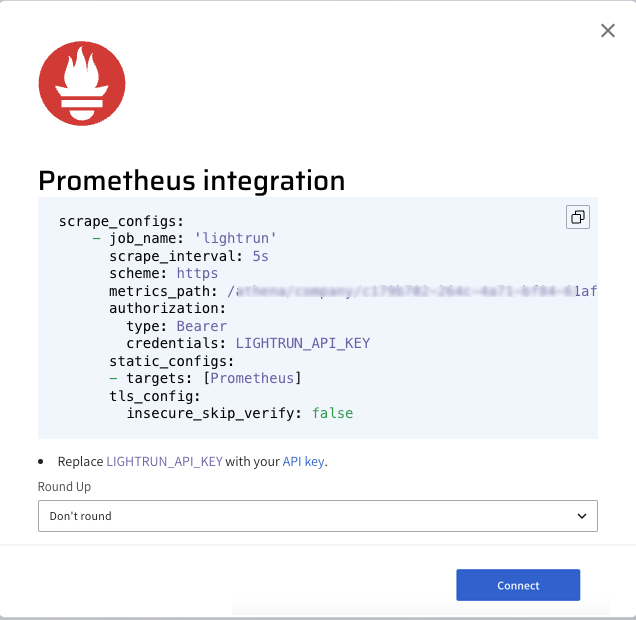
-
From the Round Up dropdown list, select the rounding rule to be applied by Prometheus for your Lightrun data.
- Click Copy from under the scrape configuration.
-
Paste the
scrape_configsdata to the existingscrape_configssection in your Prometheus YAML configuration file.
-
Start your Prometheus server.
- Click Connect and wait for the approval toast message.
Configure New Relic and Prometheus🔗
After configuring the Lightrun Prometheus integration, the next step is to configure our Prometheus server to send the collected metrics data to New Relic using the Prometheus remote_write capabilities.
To configure Prometheus New Relic remote_write connection,
- Log in to your New Relic account.
- Click Add Data in the New Relic sidebar.
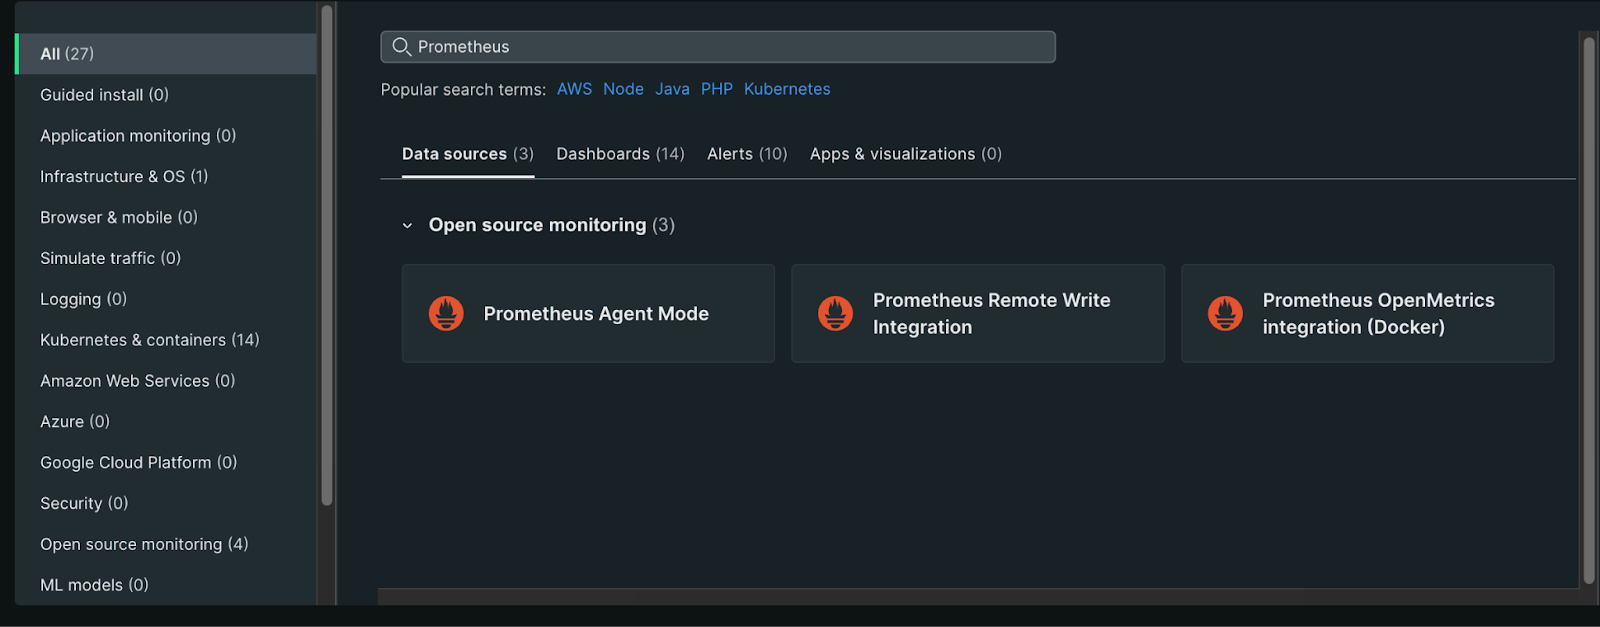
-
Search for Prometheus and select the Prometheus Remote Write Integration.
-
Enter a name to identify the data source and click Generate URL to generate the Prometheus
remote_writeconfiguration. - Add the configuration to your
prometheus.ymlfile. - Restart your Prometheus server.
Note
After adding the New Relic configuration to your prometheus.yml file, your prometheus.yml file should appear similar to the following.
# my global config
global:
    scrape_interval: 15s # Set the scrape interval to every 15 seconds. Default is every 1 minute.
    evaluation_interval: 15s # Evaluate rules every 15 seconds. The default is every 1 minute.
    # scrape_timeout is set to the global default (10s).

    # Alertmanager configuration
    alerting:
    alertmanagers:
        - static_configs:
        - targets:
            # - alertmanager:9093

    # Load rules once and periodically evaluate them according to the global 'evaluation_interval'.
    rule_files:
    # - "first_rules.yml"
    # - "second_rules.yml"

    # A scrape configuration containing exactly one endpoint to scrape:
    # Here it's Prometheus itself.
    scrape_configs:
        # The job name is added as a label `job=<job_name>` to any timeseries scraped from this config.
        - job_name: "prometheus"

            # metrics_path defaults to '/metrics'
            # scheme defaults to 'http'.

            static_configs:
            - targets: ["localhost:9090"]
        - job_name: "lightrun"
            scrape_interval: 5s
            scheme: https
            metrics_path: /athena/company/<lightrun_company_id>/integrations/prometheus/metrics
            static_configs:
            - targets: [app.lightrun.com]
        tls_config:
        insecure_skip_verify: false
    remote_write:
    - url: https://metric-api.newrelic.com/prometheus/v1/write?prometheus_server=prometheus-lightrun
    bearer_token:<new_relic_api_token>`
Confirm your integration🔗
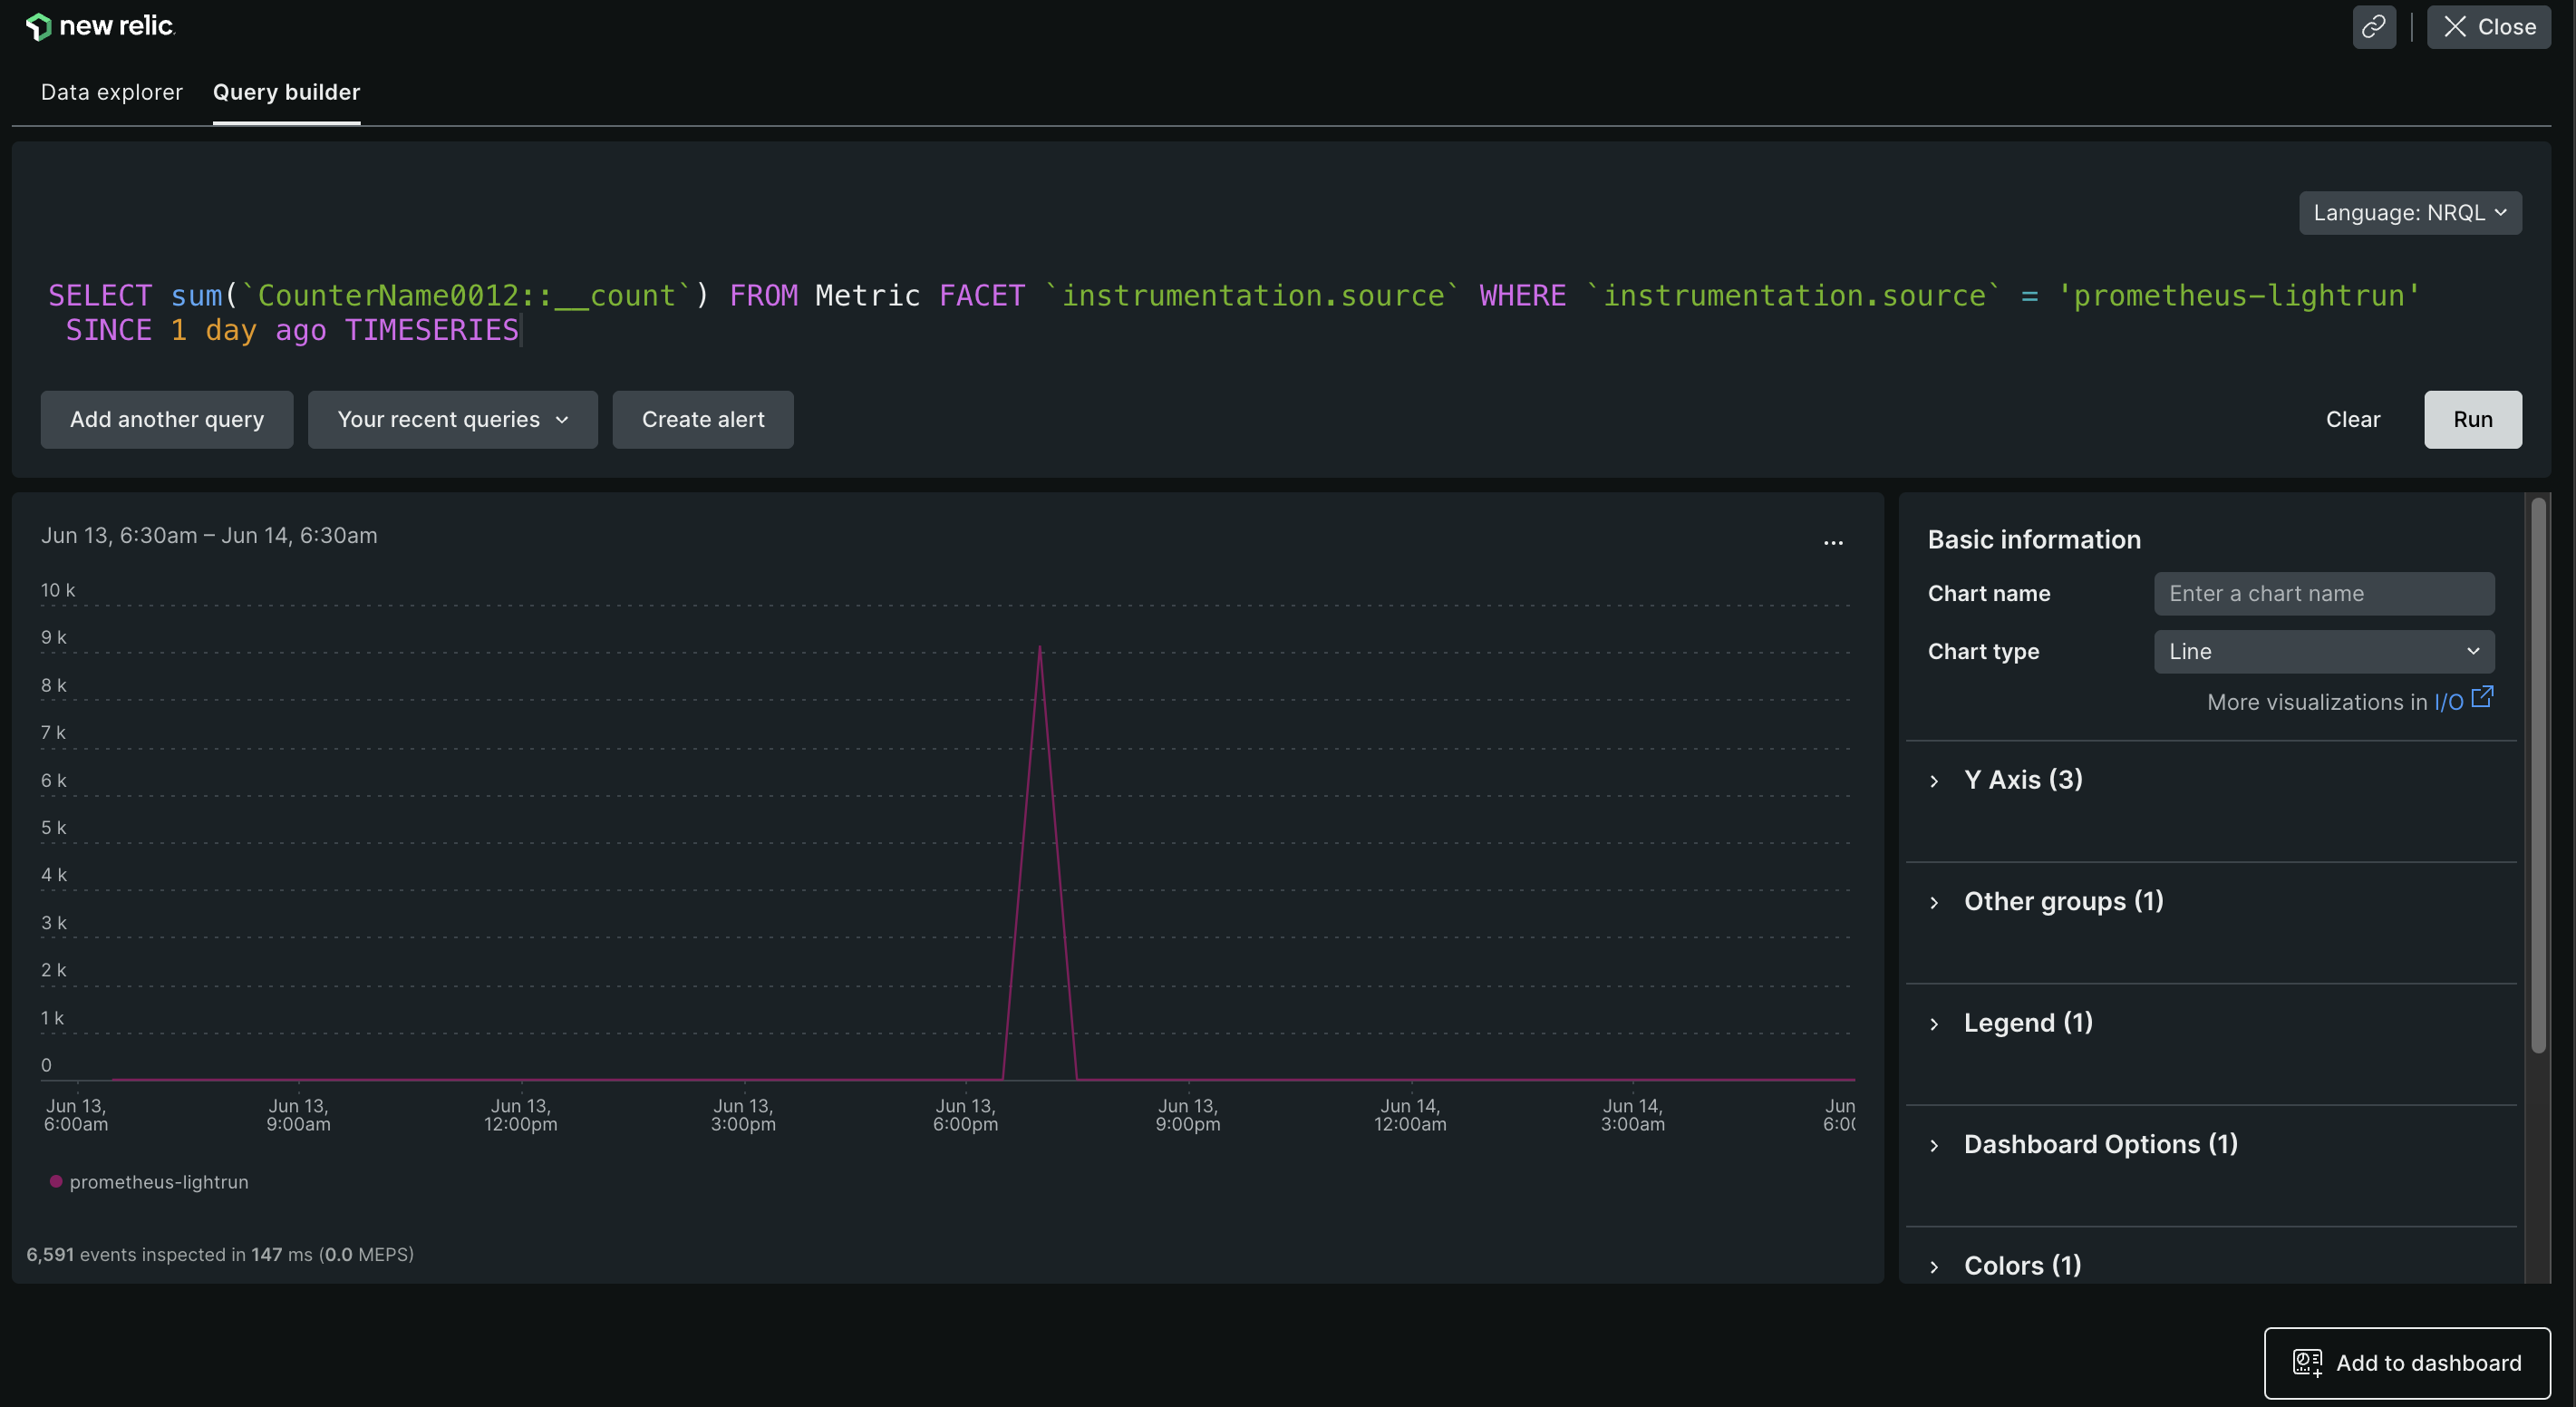
To confirm your integration, insert a Lightrun metric into your application and select Prometheus as your target. The metrics data will appear in your metrics dashboard.
Query the collected data to gain more insights on your Lightrun metrics.
Troubleshooting🔗
-
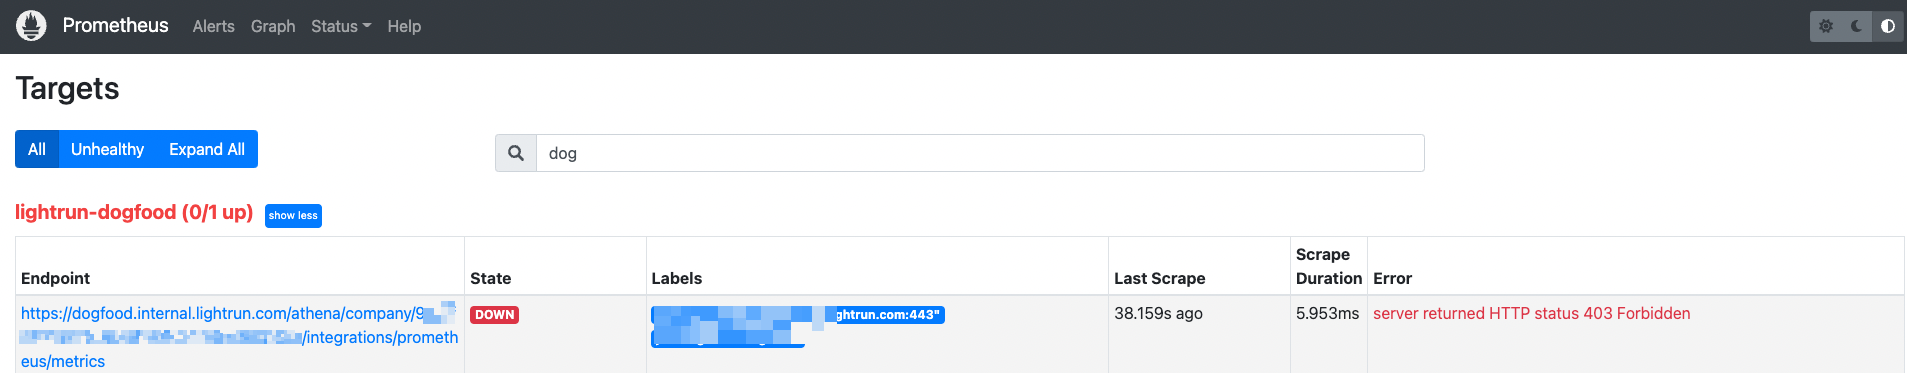
If the connection state is down, confirm that:
- Your firewall rules are not blocking Prometheus queries to the Lightrun server.
- There are no communication issues with your Prometheus server.
- If the connection state is down and there is a
server returned HTTP status 403 forbiddenerror message. This error indicates that Prometheus integration is not currently enabled in your Management Portal.