Work with Lightrun Debug Runbooks🔗
🔒 Enterprise plan required. Contact Support for access.
Limited Availability
The Debug Runbooks feature limited availability. To request access, reach out to your Lightrun representative.
Overview🔗
Debug Runbooks in Lightrun are structured, repeatable sets of diagnostic steps that can be executed during an incident to capture the right code-level evidence in real time. They remove guesswork and make it possible to standardize incident response, ensuring that crucial information is collected before it’s lost. Instead of relying on ad-hoc logging or developers manually reproducing issues after the fact, Debug Runbooks provide a predefined workflow of instrumentation (snapshots) that can be safely deployed in production, right when the problem occurs.
Why Debug Runbooks matter🔗
During live incidents, responders often face a recurring problem: the right data is not available at the right time. A failure may resolve itself, a rollback may restore stability, or logs may never have been added in the relevant code path. As a result, valuable evidence for root cause analysis is lost.
Debug Runbooks address this gap by providing a structured way to collect data during the incident itself. For example:
- Support engineers can capture the same information developers would normally need, without needing to make code changes.
- Automation can be used to freeze important production states immediately before a rollback, without slowing down the response process.
By standardizing these steps, Debug Runbooks make incident investigations more consistent and reduce the likelihood of missing critical information.
Typical use cases🔗
- Production failures that vanish before investigation can begin.
- Critical rollbacks (P0/P1) where stability is restored, but the underlying cause remains hidden.
- Recurring issues where a predefined debugging sequence saves time and ensures consistent investigation.
- Cross-team incidents where developers, SREs, and support engineers need a shared, codified way of gathering information.
Debug Runbooks terminology🔗
| Term | Definition |
|---|---|
| Debug Runbook | A Lightrun proprietary entity created by an admin and viewed by other users. It defines a set of predefined conditions that Support Engineers can execute on a specific application during a case. Debug Runbooks ensure consistent, repeatable workflows for diagnosing and resolving issues in a specific application. |
| Case | A single execution of a Debug Runbook against a faulty application. Each case is initiated through the Lightrun Management Portal by Support Engineers and consists of one or more conditions defined in the Runbook. Each case stores the data and results captured during its execution and is intended for one-time use. |
| Runbook template | Contained in the uploaded Debug Runbook. |
| Runbook instance | An instance of the Runbook template assigned to a case. Multiple instances of the same template can exist. |
| Method Snapshots | A customized version of Lightrun snapshots designed for Debug Runbooks, providing enhanced stability and resilience across version changes. They are placed on a file name and method name. Snapshots provide input, output, and method duration details. They only break if the method is deleted or renamed. |
Debug Runbooks role and permissions🔗
Debug Runbooks usage in Lightrun is governed by a well-defined role and permissions. Lightrun introduces a dedicated Incident Responder role which is responsible for creating and managing cases. At the same time, the Debugging Runbooks category is shared across a number of roles. For an overview of Lightrun roles, see Lightrun Persona-based roles overview.
The following table summarizes the permissions available under the Debugging Runbooks category for the different roles.
| Permission | Company Admin | Company Viewer | Incident Responder | Developer / Group Admin |
|---|---|---|---|---|
Upload a configuration file. | W/R | R | - | - |
Create and manage cases (including running Debug Runbooks). | W/R | - | W/R | - |
View Case results. | R | R | R | R |
Legend: W/R Write/Read | R Read only | – No access
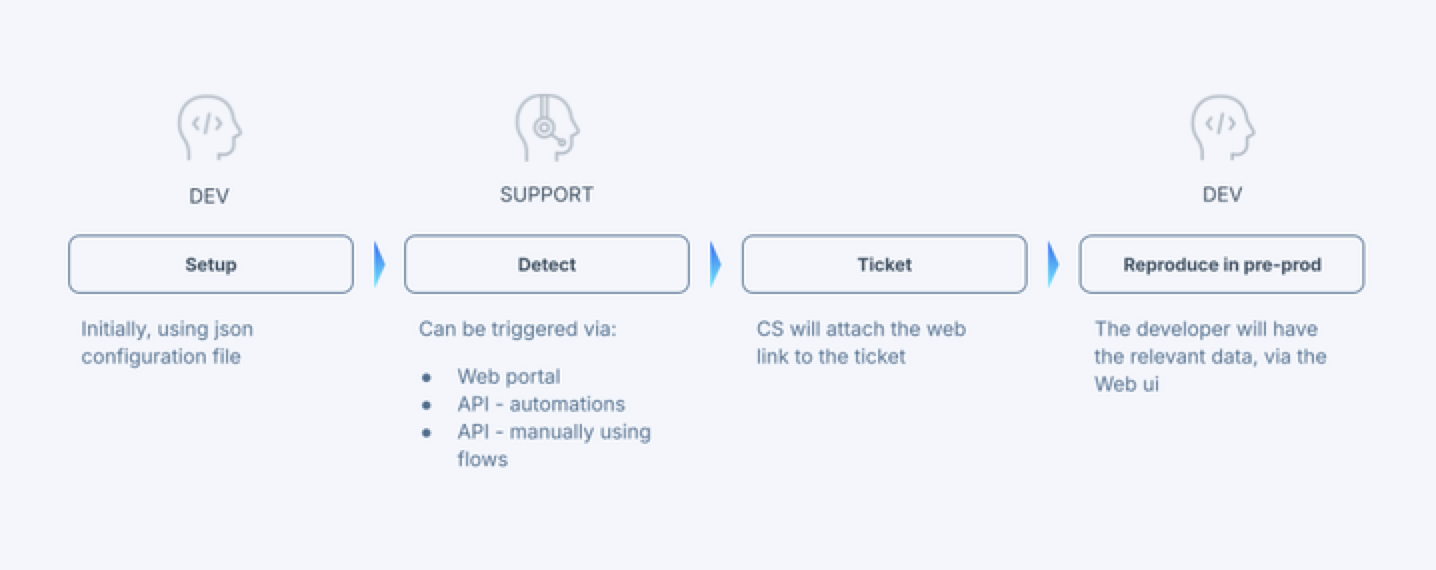
Debug Runbooks workflow🔗
The Debug Runbooks workflow describes how Runbooks are used during incidents to capture, organize, and analyze diagnostic data for faster resolution.
-
Preliminary stage – runbook creation
Admins define a Runbook in advance within the Lightrun Management Portal, specifying the diagnostic data to be captured.
-
Incident occurs
A customer reports an issue to the Support team.
-
Run Case (Runbook execution)
A Support Engineer initiates a case, which is the execution of one or more predefined Runbooks against the faulty application.
-
Developer analysis
The captured data is made available through a shared URL, allowing the developers to see all hits captured in real time.
Create a Debug Runbook🔗
Required Role: Company Admin
Important
During the Limited Availability phase, Runbooks can only be created through your Lightrun Account Manager. The information below is provided for informational reference only.
The Debug Runbook is generated as a JSON file and uploaded to the Lightrun Management Portal by the user assigned with the Company Admin role.
Step 1: Identify and define Debug Runbooks🔗
This section explains how to select and structure Debug Runbooks for consistent, effective use across teams.
Review the best practices below to guide the creation and definition of Debug Runbooks before proceeding to implementation.
| Best Practice | Details |
|---|---|
| Focus on frequent use cases | Select 5–10 runbooks that the Support team encounters regularly. Prioritize issues that block users or require quick triage. |
| Use user-facing language | Name runbooks based on the observable symptom rather than the technical cause. ✅ “Can’t add trade” ❌ “TradeExecutionService failure” |
| Allow overlapping runbooks | It’s acceptable to create multiple runbooks for related issues if they reflect how Support describes the problem. Example: “Can’t add user” vs. “Can’t add users via SCIM”. |
| Keep scenarios simple | Choose use cases that can be explained without requiring developer knowledge of components, microservices, or code paths. |
| Decide what to capture | Select methods, logs, or metrics that give developers enough context to understand the issue without reproducing it. If a developer needs to see what happens at a specific line in a method, include the method being called from that line in the Runbook. |
| Define arguments | Add runtime arguments (e.g., companyId, userId, uuid) so Support can adapt the Runbook per incident. |
| Apply conditions if needed | Use conditions sparingly to focus data collection (for example, filter by user or request type). |
| Ensure useful evidence | Capture enough information—snapshots, inputs/outputs, durations, error codes—to help developers analyze incidents later. |
| Define clear scope and guardrails | Keep runbooks focused on a single intent. Limit runtime duration and sampling to avoid unnecessary load. |
Proceed to create the runbooks.
Step 2: Create the JSON configuration file🔗
Required Role: Company Admin
Tip
If you have a JSON configuration, download it as a backup before uploading the new one.
JSON configuration file guidelines🔗
General
- Up to 3 arguments can be defined per Runbook.
- A single Runbook can include up to 10 methods.
- Up to 10 expressions can be defined per method.
- Each method supports up to 20 hits.
Arguments
Arguments are defined per Runbook and are shared across all methods within that Runbook. They allow dynamic data capture for different users or entities during the Runbook execution.
Each argument includes the following fields:
- Variable name: The identifier used in the condition.
- Label: The text displayed to the user in the Runbook form.
- Description: A short explanation shown as a tooltip to help the user provide the correct input.
Argument guidelines
- Use arguments in conditions with the syntax:
${variableName}.
Conditions must be written as strings. A maximum of three arguments can be defined per Runbook. - When defining arguments, try to include those that help capture the most relevant data — for example, company ID, user ID, or UUID.
- In regular snapshots, conditions are used to capture specific results (for example, only trades from a specific user).
When using Debug Runbooks, arguments allow users to provide a different value in each execution — for example, capturing data for a different user on every run.
Example: Using arguments in Debug Runbooks
- When creating the Runbook, define an argument (for example,
userId). - Trigger the Runbook from the IDE.
- Provide the required
userIdvalue at runtime. - The Runbook will capture the relevant snapshots (input, output, and duration) based on the provided argument.
Example conditions:
- Regular snapshot →
userId == 123 - Runbook with argument → argument:
userId→ provided at runtime as456 request.getUserId().equals("${user}")
Methods
- A single Runbook can include up to 10 methods.
- If multiple methods with the same name exist in the same file, only the first occurrence is used.
Expressions
- Apply to the method entry snapshot (
snapshot in).
Action target
- In release version 1.70.3, actions can only be set with the
plugintarget. - This setting is not auditable and is applied by default.
Blank JSON template🔗
Use this template as a starting point when defining your own Runbook JSON configuration. Replace the placeholder values as needed.
  {
    "runbooks": [
      {
        "name": "<runbook_name>",
        "arguments": [
          {
            "label": "<argument_label>",
            "variableName": "<variable_name>",
            "description": "<description_of_argument>",
            "expirationDurationMinutes": "<expiration_duration_in_minutes>"
          }
        ],
        "methods": [
          {
            "filename": "<filename>",
            "methodName": "<method_name>",
            "maxResults": <max_results>,
            "methodTimeoutSeconds": <timeout_in_seconds>,
            "condition": "<condition_expression>",
            "watchExpressions": []
          }
        ]
      }
    ]
  }
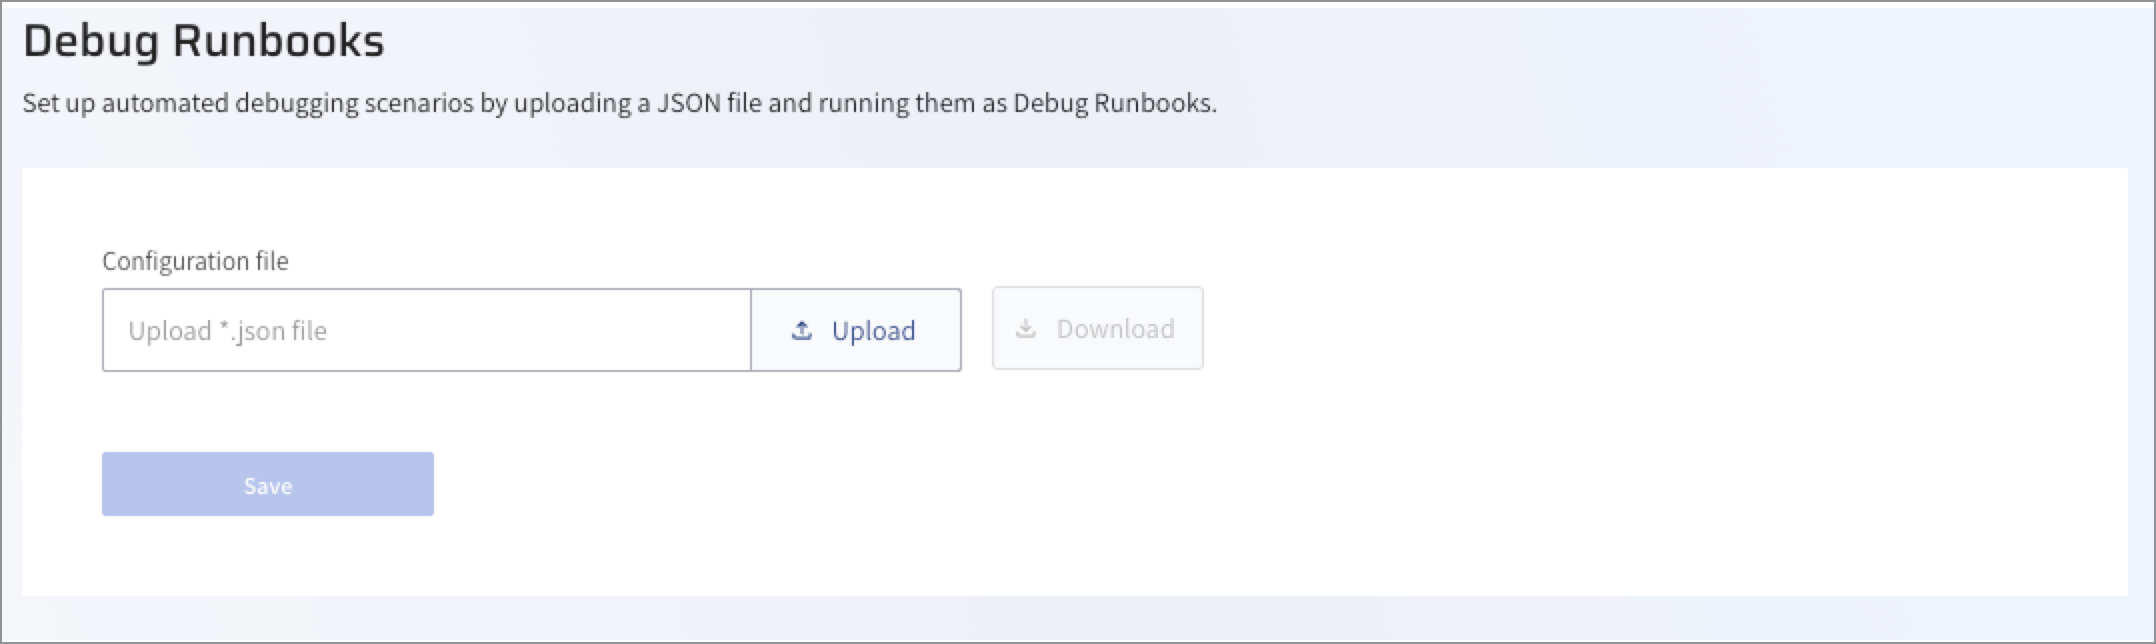
Step 3: Upload the JSON to the Lightrun Management Portal🔗
- Log in to the Lightrun Management Portal.
- Click Settings in the menu bar.
-
In the left navigation bar, under the Debug Runbooks section, select Configuration File.
The Debug Runbooks page opens.
-
Click Upload.
- Select the JSON file from your local drive, and click Open.
- Click Save.
Create and run Debug Runbook cases🔗
Required roles: Company Admin, Incident Responder
Step 1: Create a case🔗
- Log in to the Lightrun Management Portal.
-
In the left navigation bar, click Debug Runbooks.
-
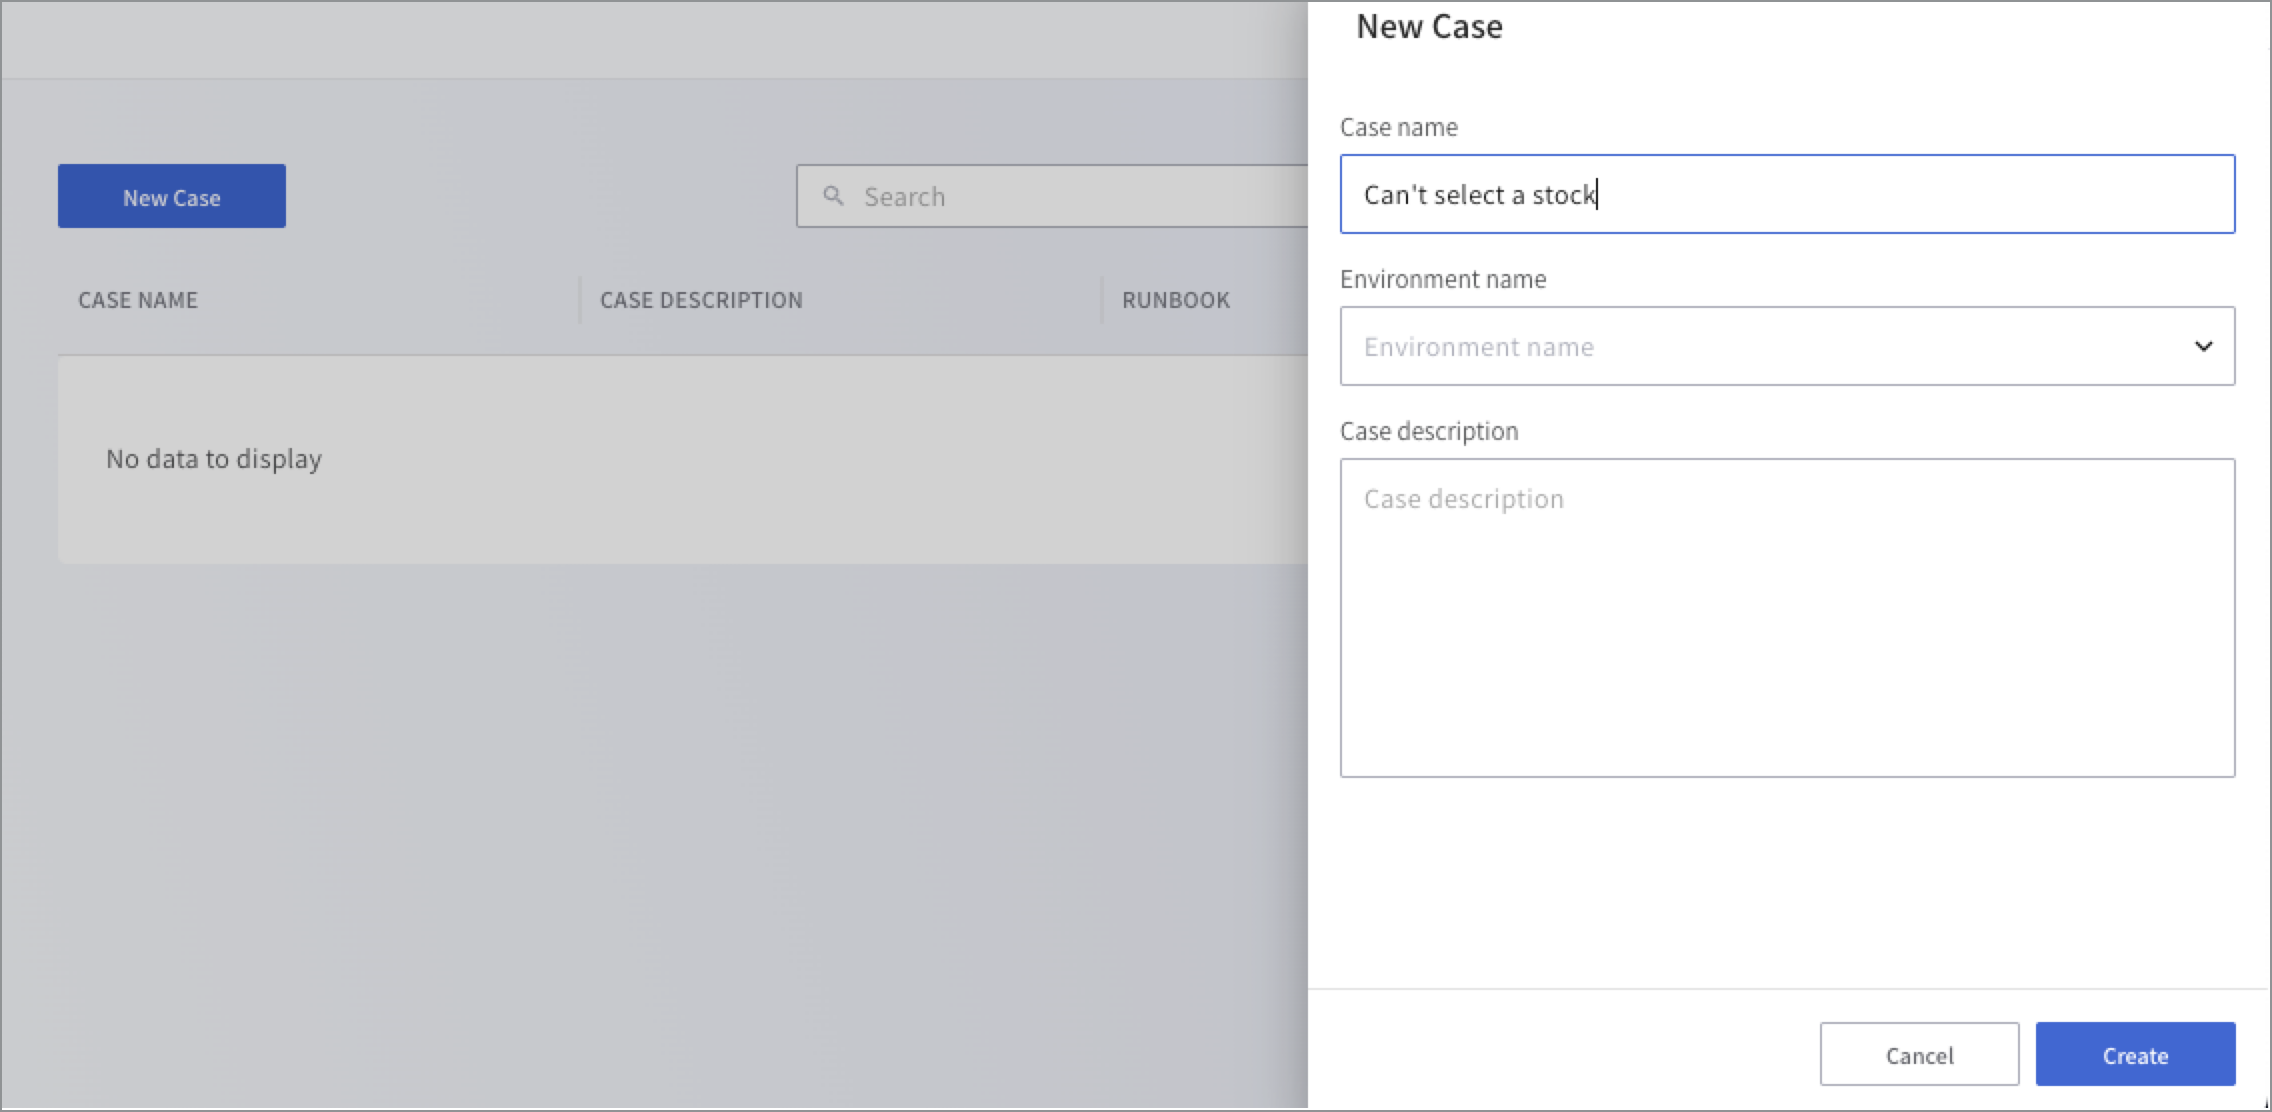
Click New Case.
The New Case dialog opens.
-
In the Case Name field, enter a descriptive name that helps stakeholders understand the context.
-
Select an Environment from the list to run the case. An environment tag is assigned to a predefined Lightrun agent that runs the application and can also be a custom source that contains multiple agents and tags. Each case can run on only one environment.
-
Under the Case description, enter the description or paste a link that will allow users to understand what the case was trying to troubleshoot. Examples are: can’t place an order in the stock application.
-
Click Create.
A dedicated case view opens with the basic information you entered in the previous step.
-
Click Add Runbook.
The Add Runbook dialog opens with the listed runbooks
-
Select a Runbook checkbox. Each case can run multiple runbooks.
- Click Add.
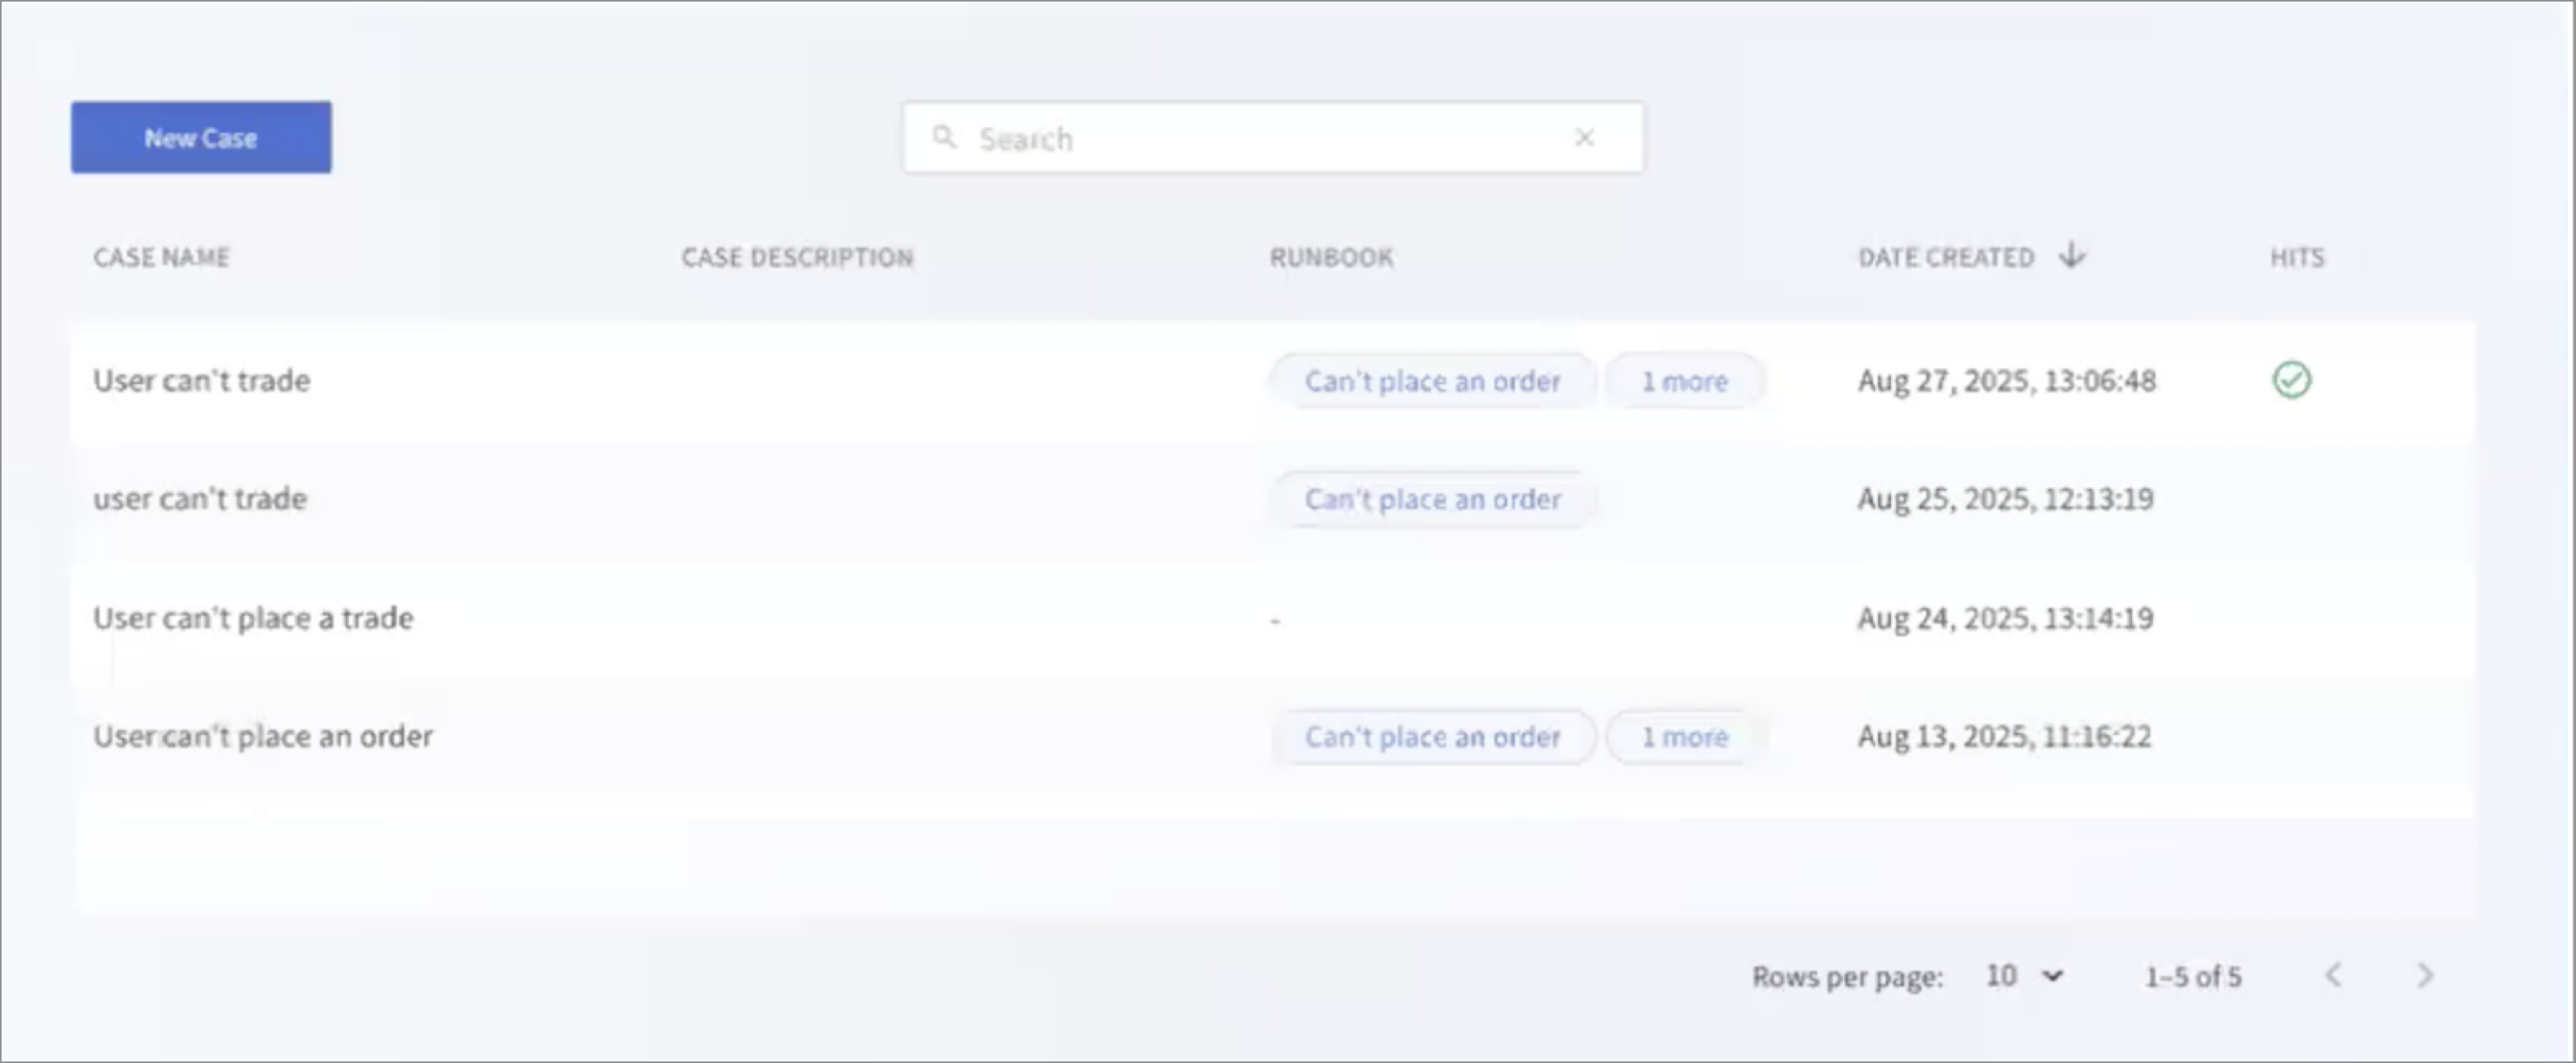
Once created, the case instance is added to the Runbook list and can be viewed by the user who created it, in addition to those who have received a shared link.
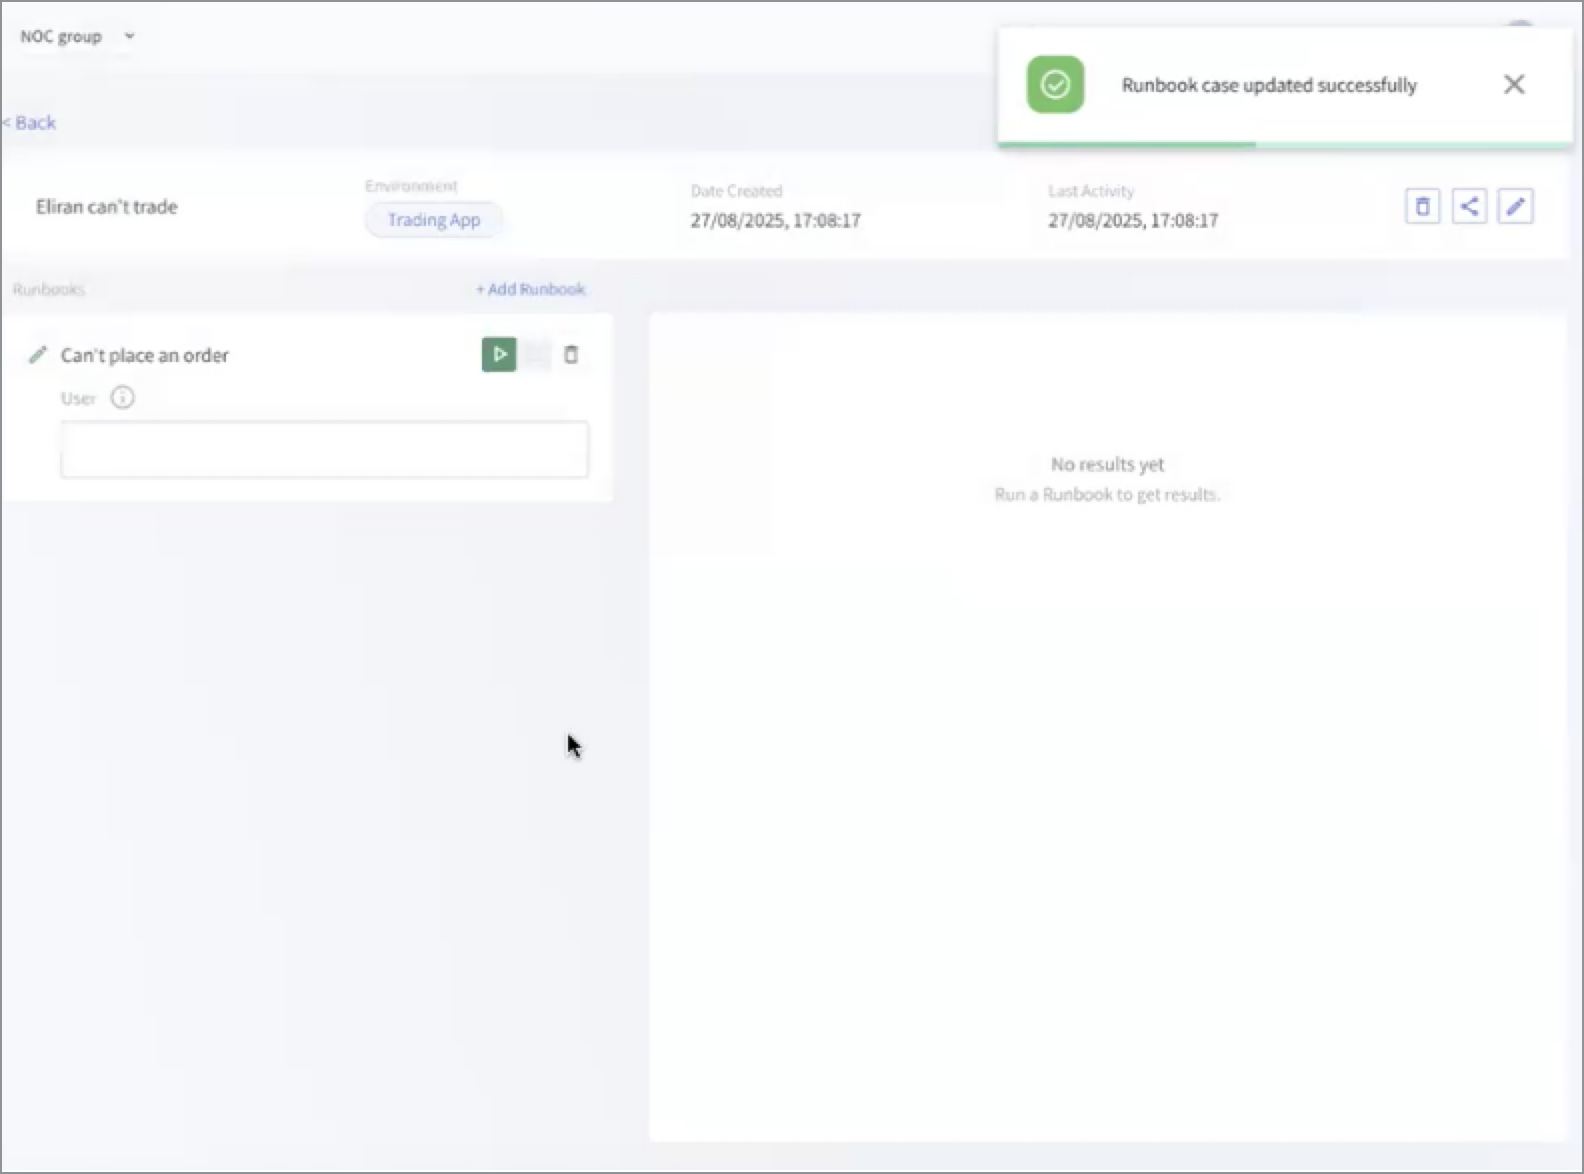
Step 2: Run the Debug Runbook🔗
-
In the Case page, select the required runbook to run.
An instance of the case is added to the runbooks list.
-
In the User field, type a user-friendly text to identify the instance. For example,
name. -
Click the Run icon.
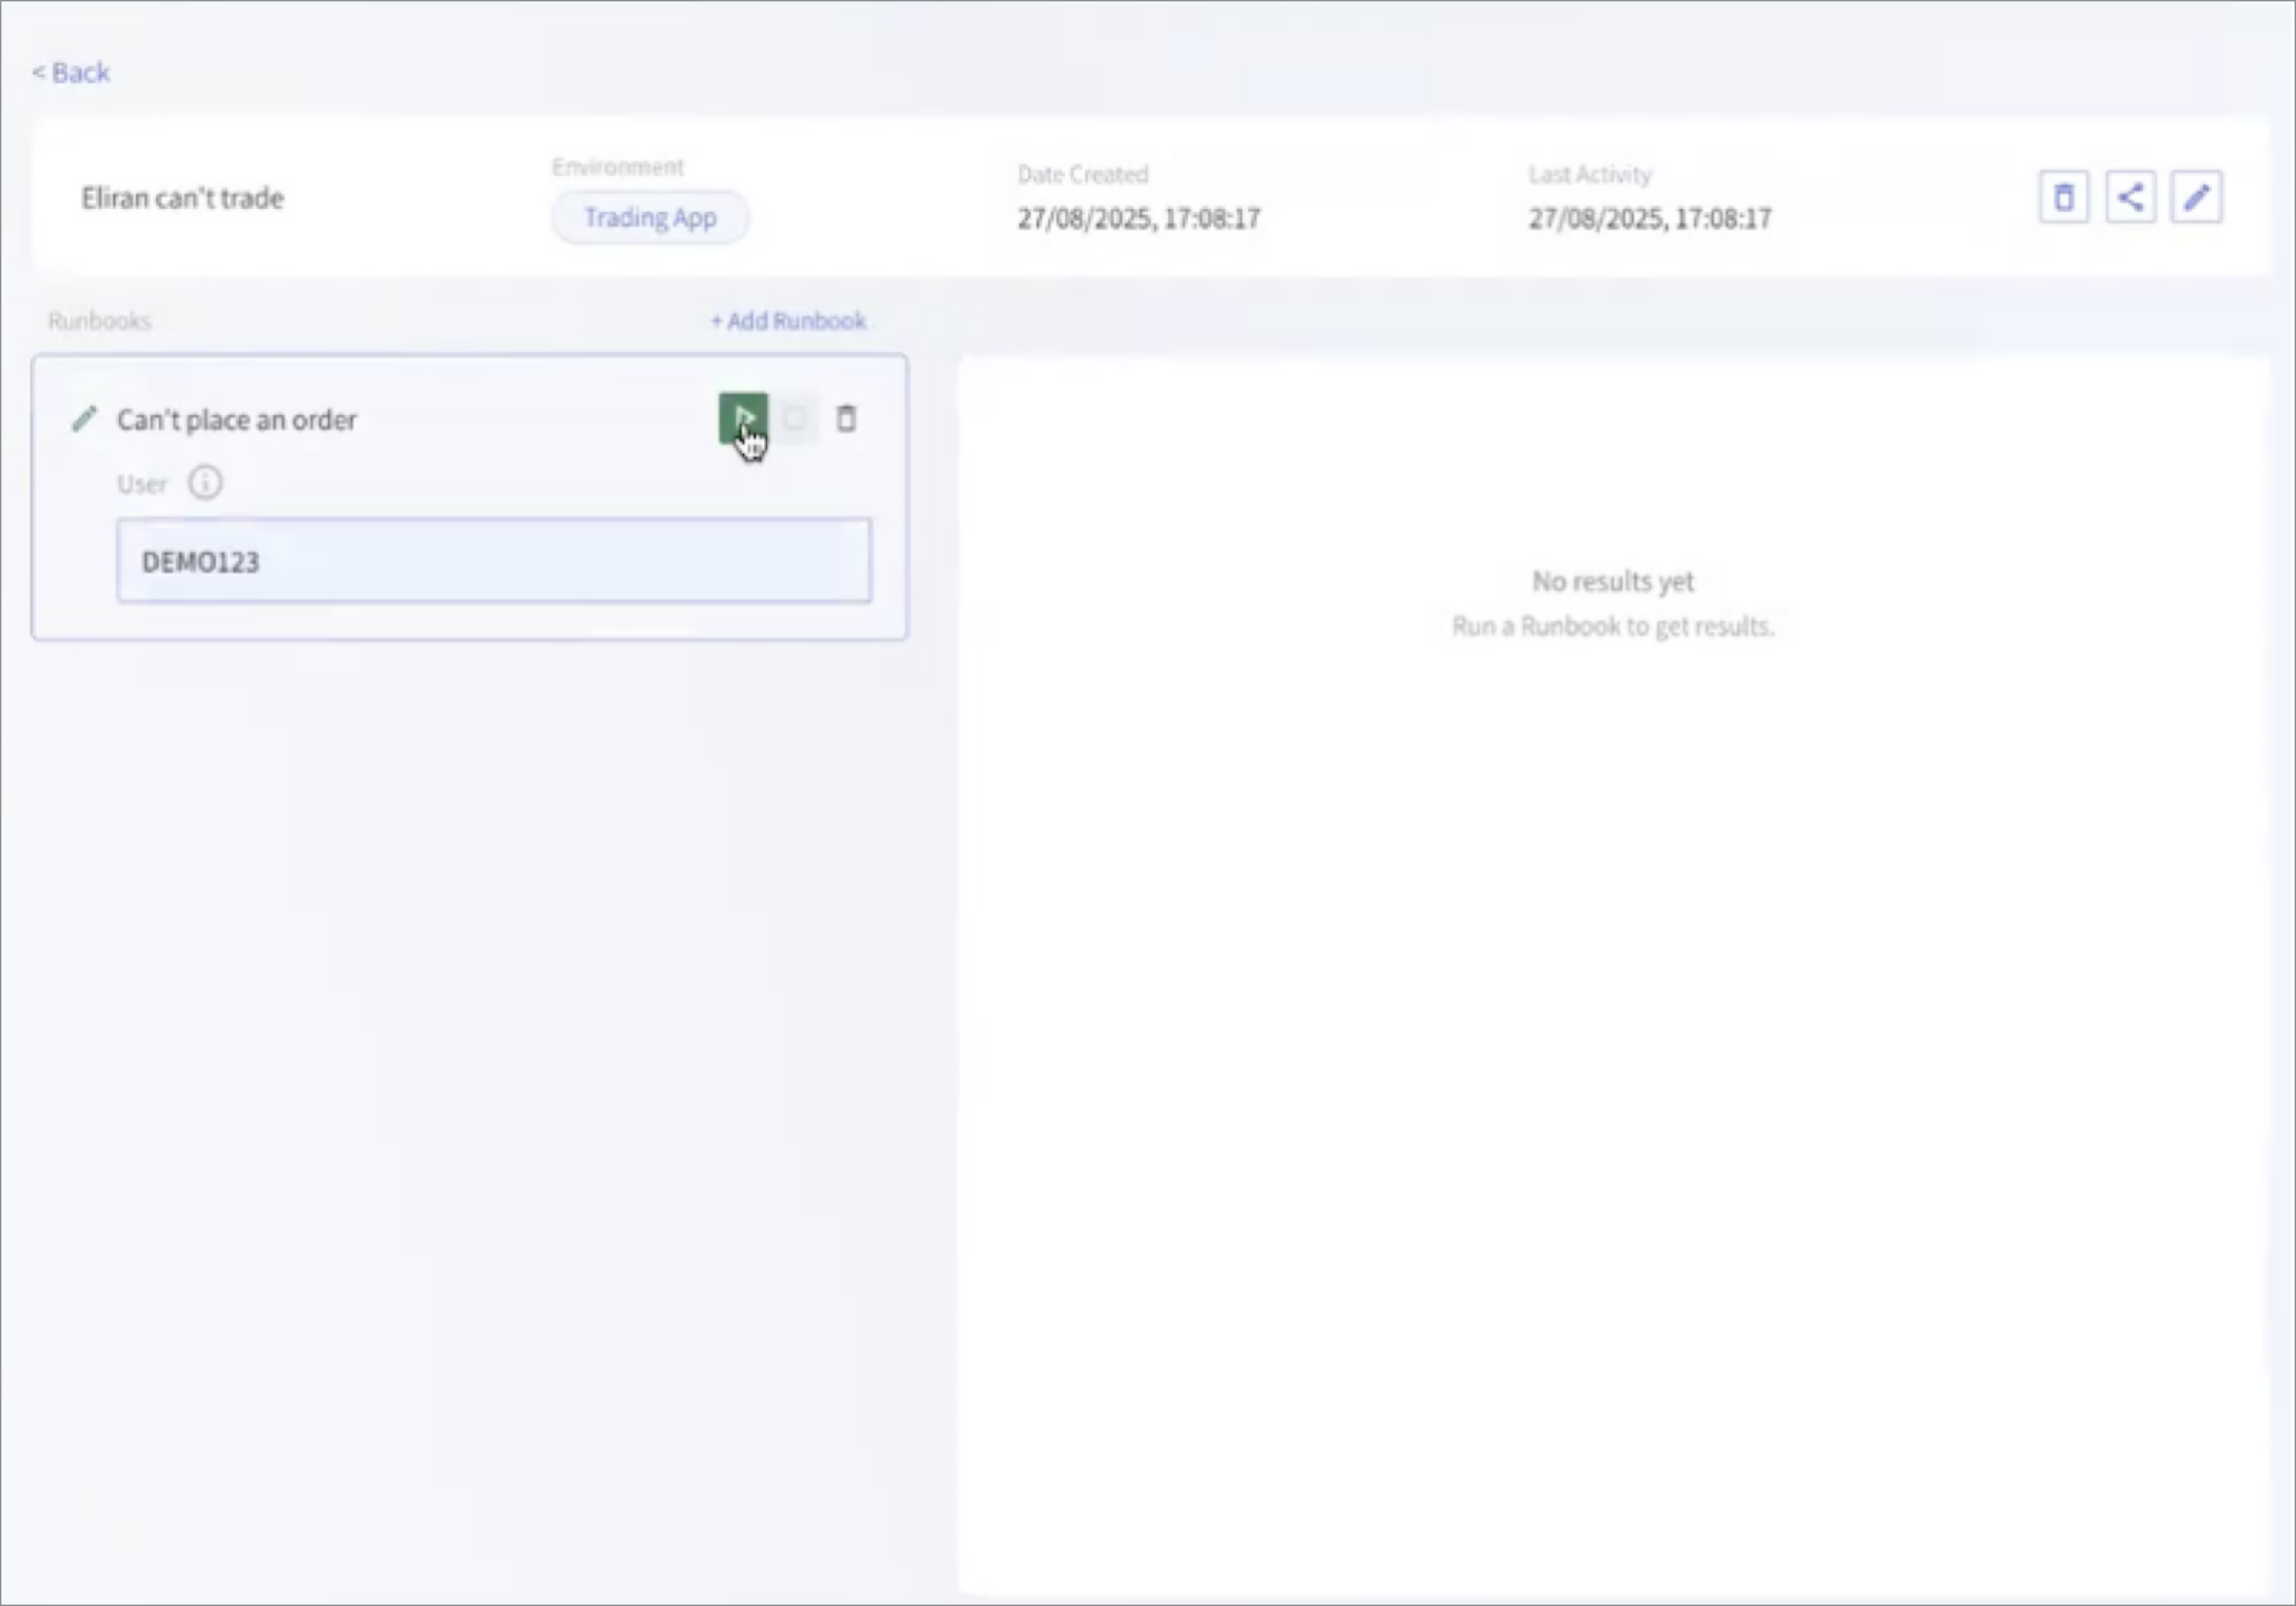
A red icon indicates that the Runbook is running.
-
Go to the application and perform the steps to reproduce the failure scenario. This allows the Runbook to generate Snapshot hits in the relevant code.
If you’re not sure which Runbook applies, you can add and execute multiple Runbooks—especially if their scopes overlap.
If you don’t get the expected results, you can modify the setup: change the environment, add or remove Runbooks, or edit Runbook parameters. Then click Play again to rerun the Case.
Important
Each time you click Play, the previously captured Snapshot hits for that case are overwritten.
Step 3: Share Debug Runbook hit results🔗
Required role: Incident Responder: View Case results permission.
-
Under the relevant case, select the case to be shared.
-
Click the Share icon to share the case with the developer.
A link is generated.
-
Paste the link to the ticket, which can be viewed by the developer at a later stage.
View and analyze the case results🔗
Required role; Incident Responder: View Case results permission.
Retention: Case Hit results are retained for three months, after which they expire.
The results of the Runbook cases are displayed on the Debug Runbook page in the Lightrun Management Portal.
To view these results, the role assigned to you must include the View cases results permission, which grants read-only access. Note that users with the Developer role have minimal permissions — they can view Case results only through a shared link, since they do not have direct access to the Debug Runbook page in the Portal.
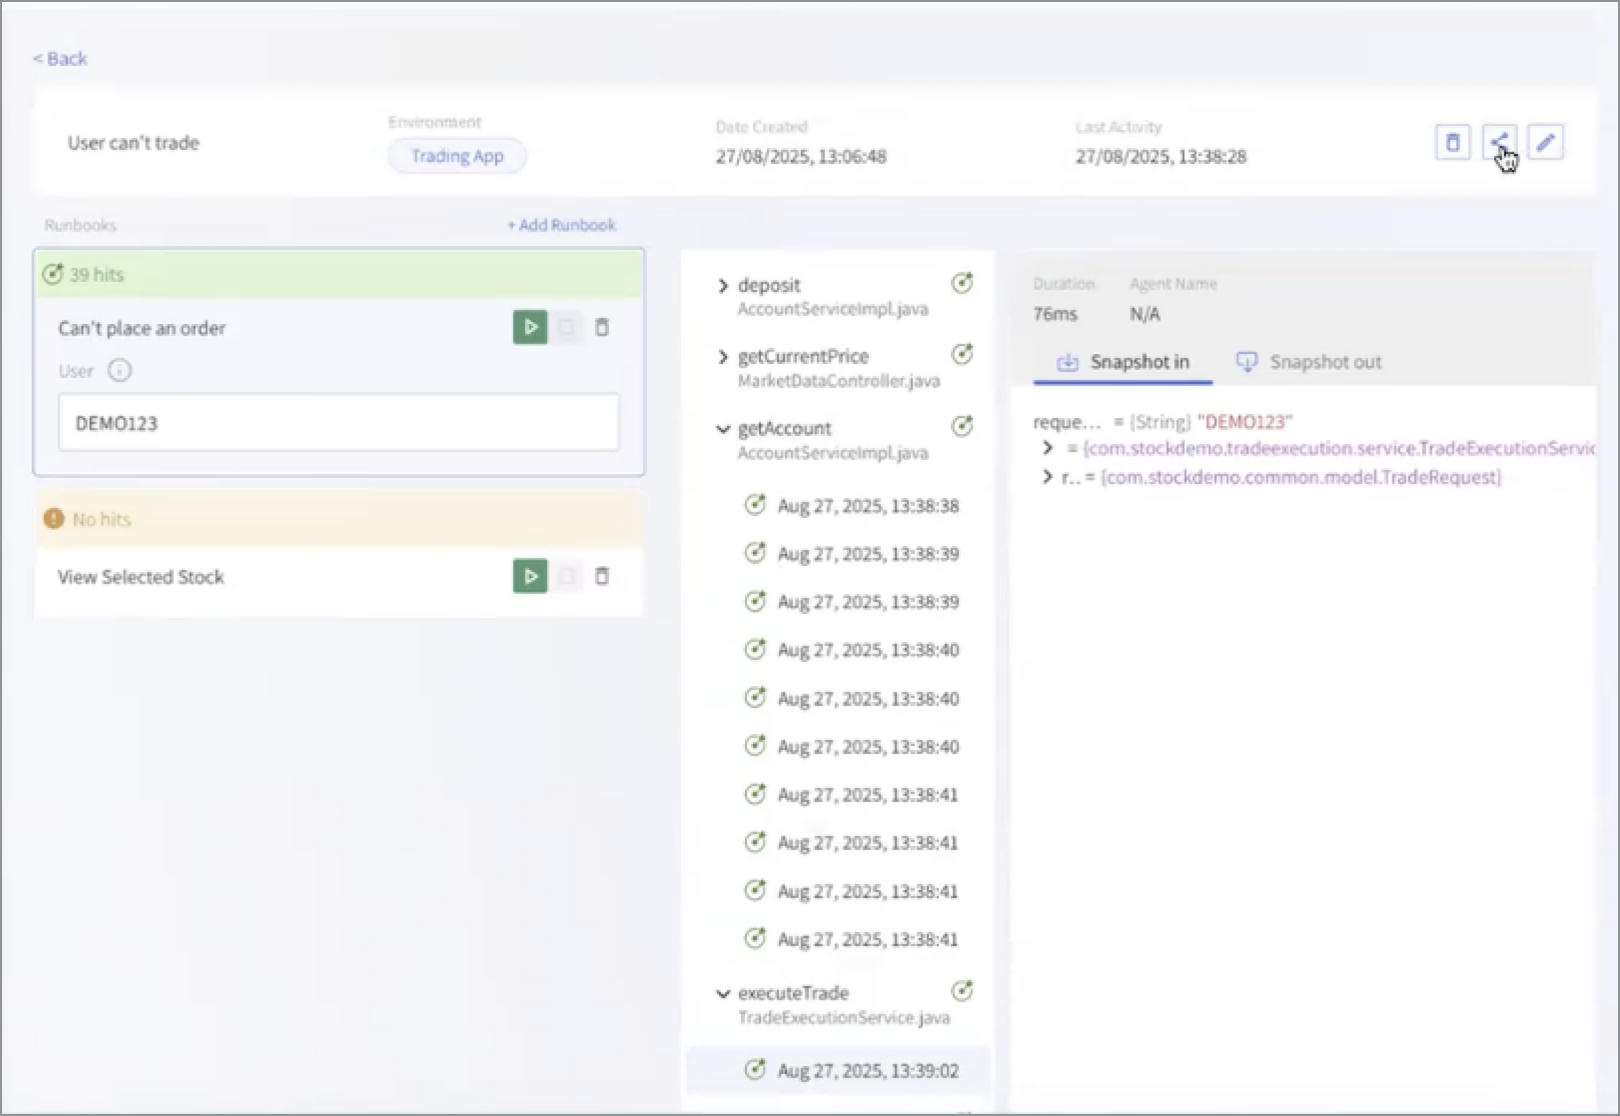
-
Click the shared link you received to open the dedicated URL.
The page displays the Runbook case results, including a list of hits per Runbook instance, along with the
DurationandAgent Namefor each entry. -
Click a hit to view its
Snapshot InandSnapshot Out, showing the relevant code context.The hits are listed chronologically, from earliest to latest.
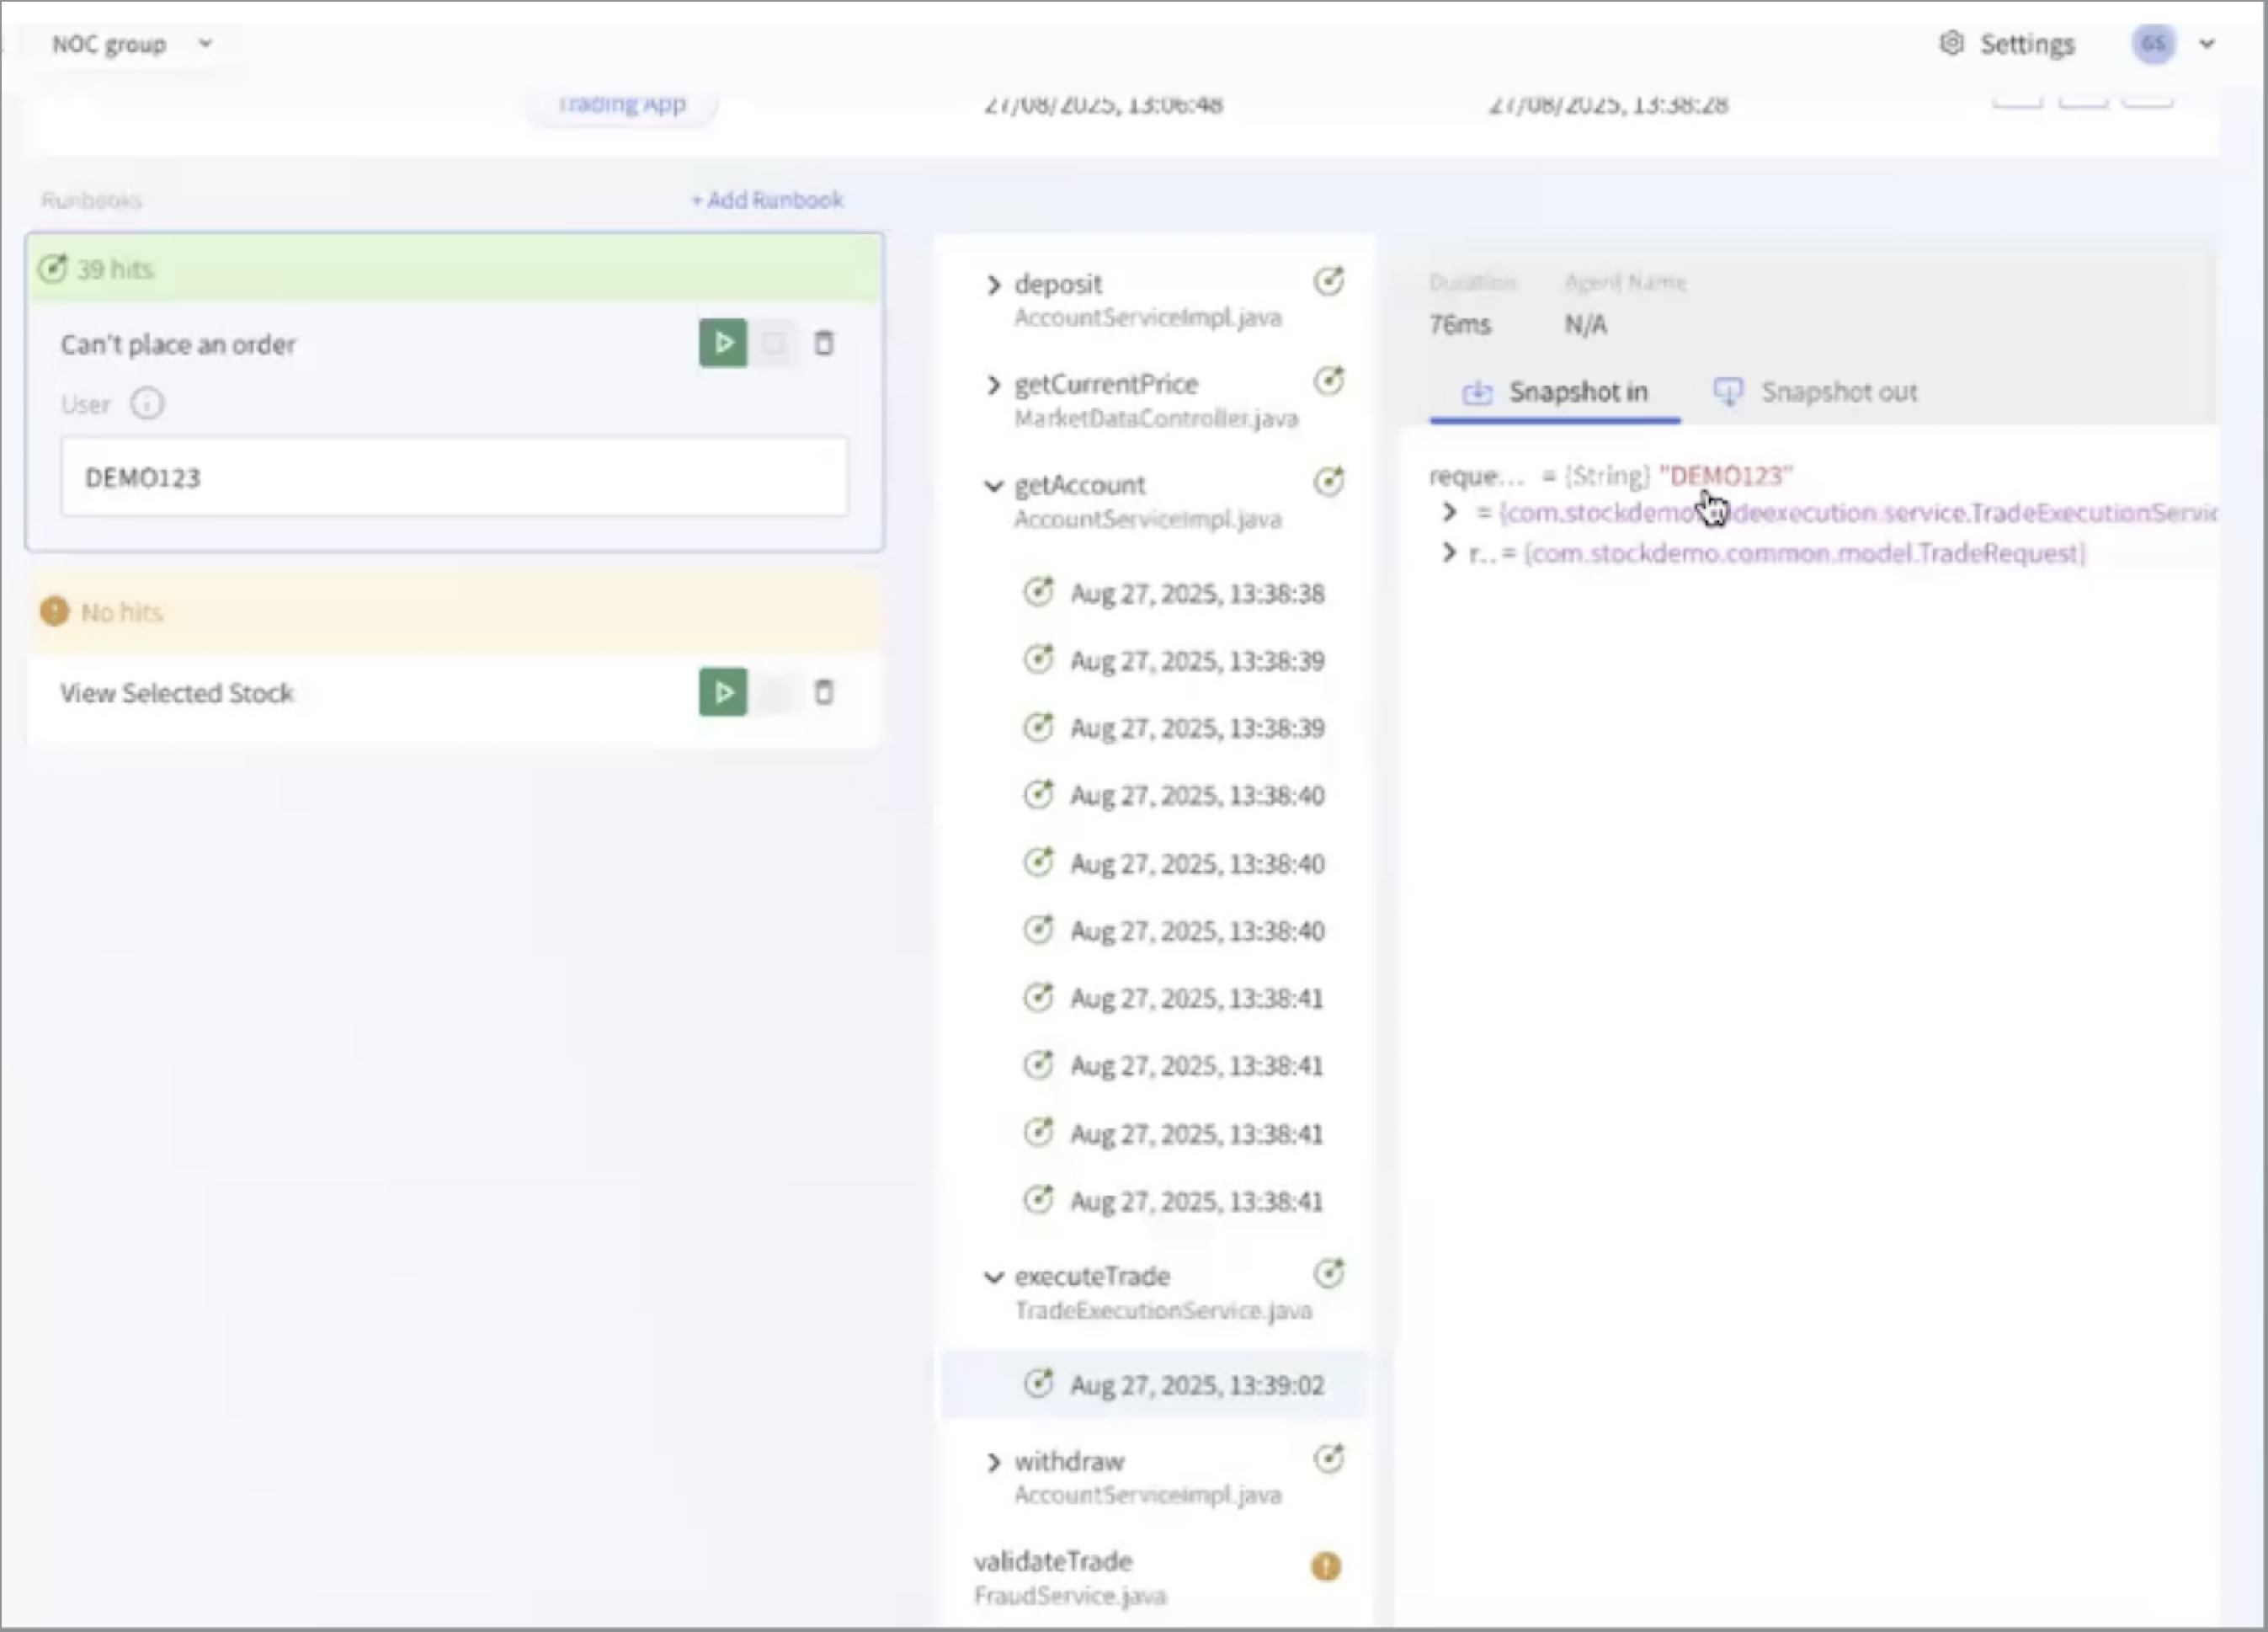
-
Proceed to debug the code.