Work with Lightrun Metrics in the VS Code IDE🔗
The Lightrun plugin for VS Code currently provides three different metrics action for monitoring the performance of your code and identifying issues:
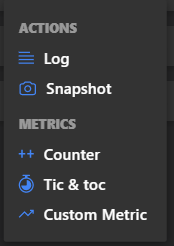
- Counters - Counts the number of times a specific line of code is reached.
- Tic & Toc - Measures the elapsed time between two selected lines of code within a function.
- Custom Metrics - Create customized metrics, using parameters and simple or complex expressions that return a
long intresult.
The following subsections describe:
- How to add a metrics action to your running application.
- Configuration option for each metric action.
- Managing a metrics action directly from your VS Code IDE.
Prerequisites
To use the plugin, ensure that:
- An agent is attached your application.
- The plugin is installed in your local VS Code instance.
- The Plugin ia authentication against your Lightrun account.
- The source code file for your running application is opened in VS Code.
Support
Metrics are currently supported only for Java/JVM applications.
Add a Metric🔗
-
To add a metric, select one of these methods:
-
From the Agents or Tags tab {#agentsortabs}
- Open the Lightrun Sidebar in your VS Code IDE.
- Navigate to the Agents or Tags tab and select an agent or tag.
- Click the Add Action icon
 on the agent or tag.
 - Select your preferred metric from the menu that appears.
- Directly from the Code line{#codeline}
- Go to the line in your application source code where you'd like to insert the metric. Make sure to use the source code version currently deployed to your remote app (where the agent is attached).
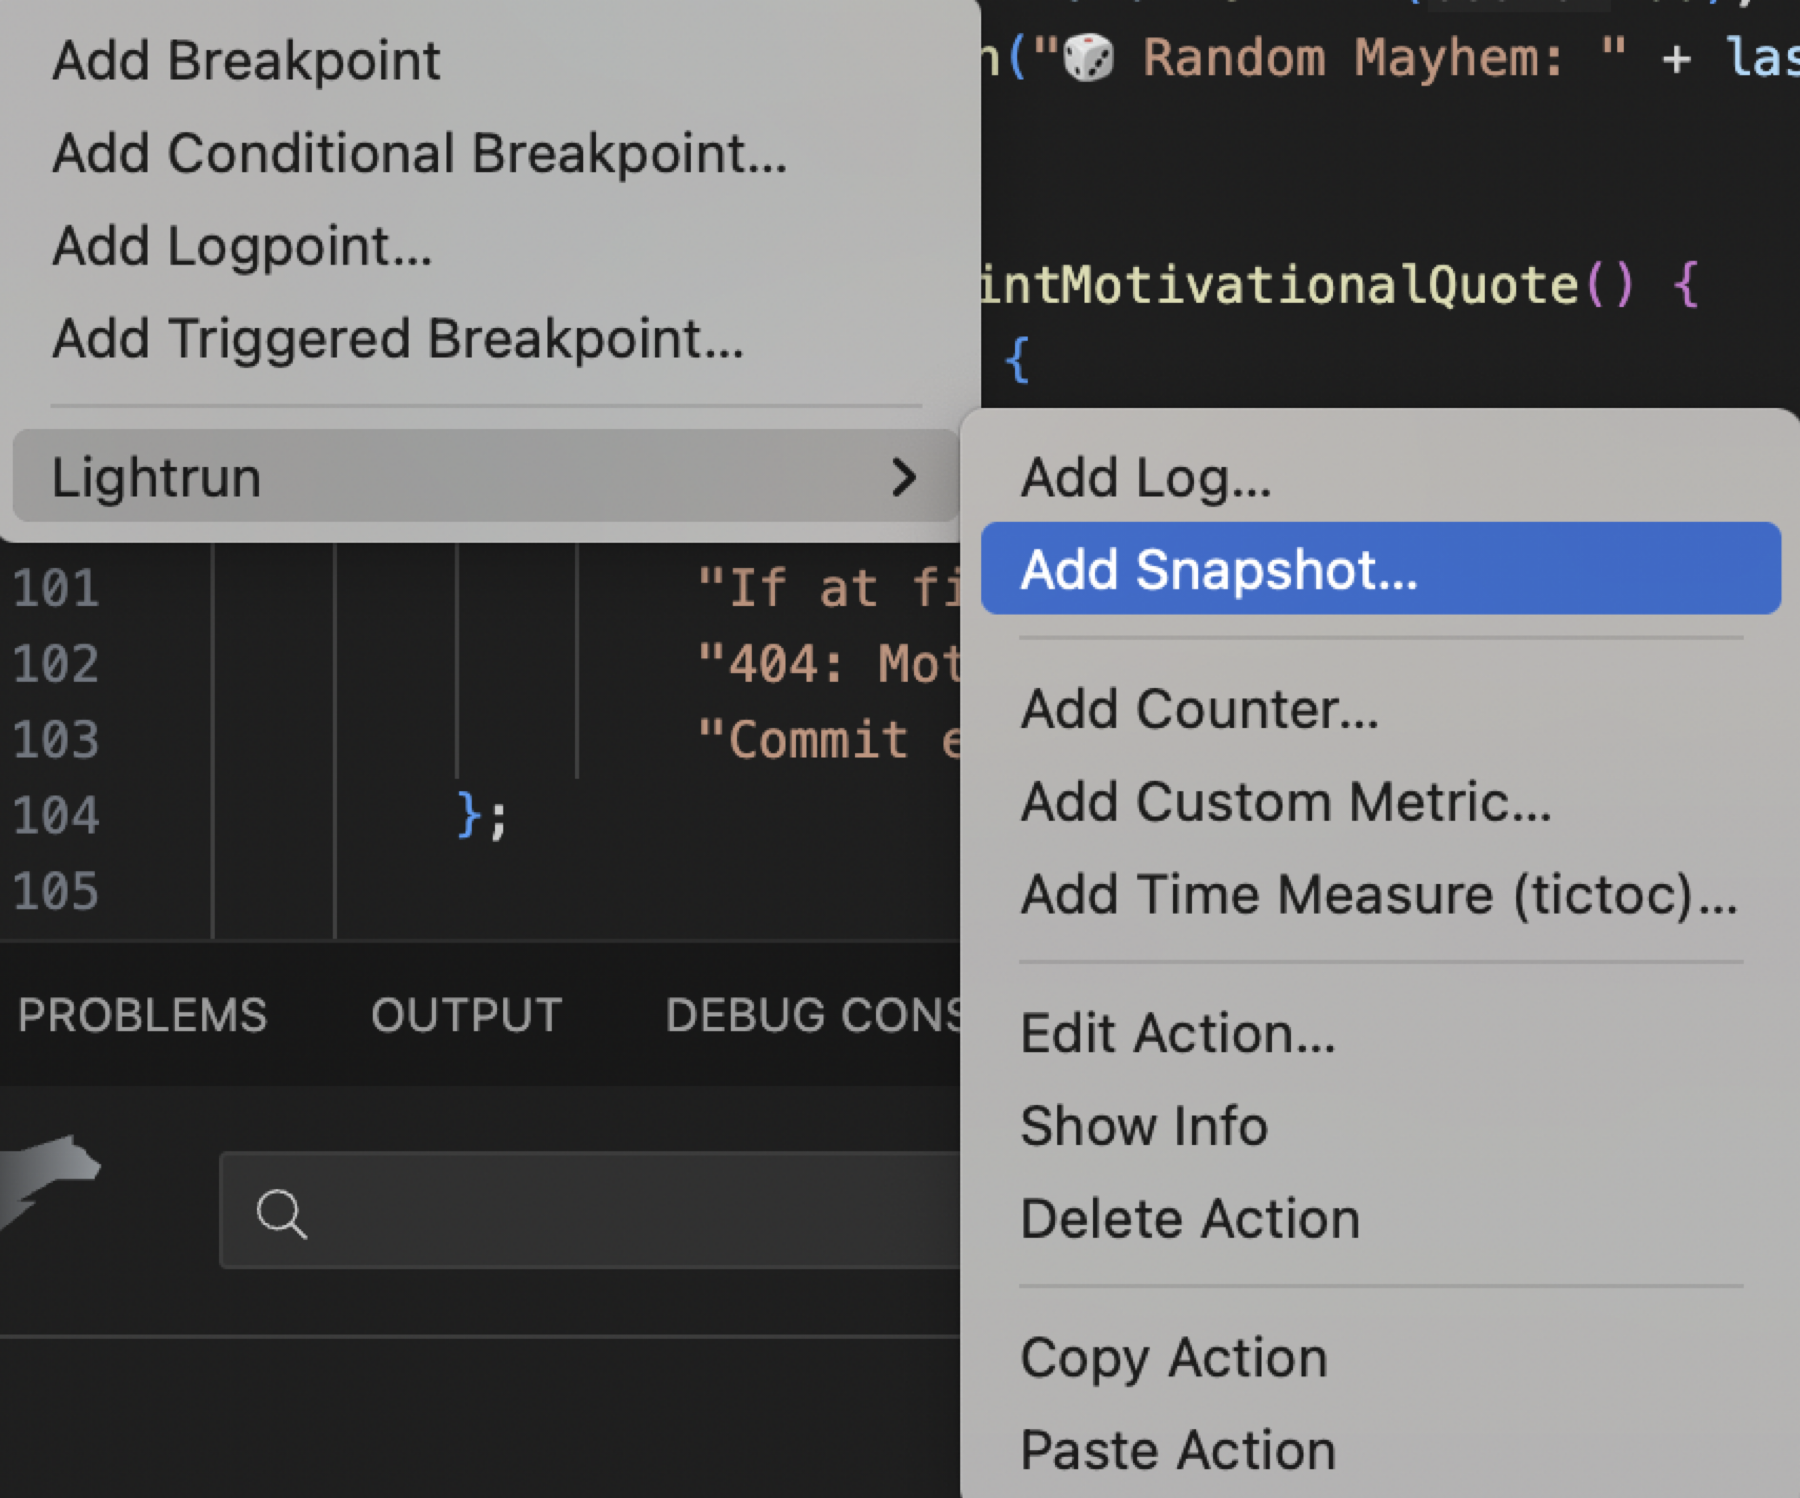
- Right-click to open the VS Code context menu.
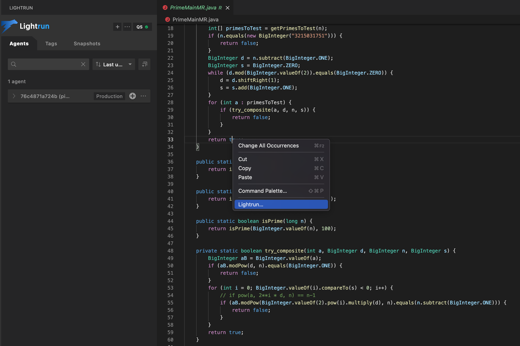
-
From the VS Code context menu, click Lightrun....
The VSCode Command Palette opens with a list of Lightrun plugin options.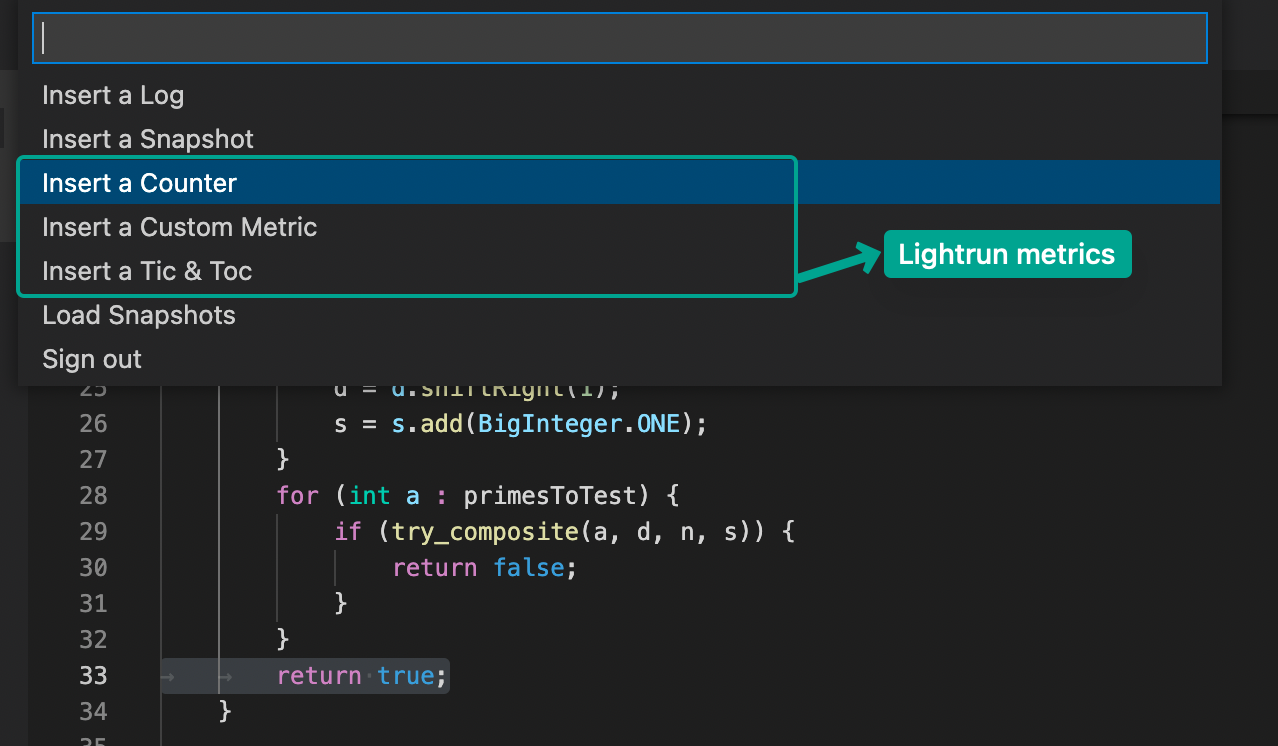
From version 1.58, for the Java plugin, you can select the metric from the List.
-
Select your preferred metric in the VS Code Command Palette.
-
Configure Metrics🔗
Counter🔗
A Lightrun Counter counts the number of times a specified line of code is reached and outputs the data periodically to the configured action target.
With a Lightrun Counter output, you can obtain a deeper insight into the state of your application's code, at any level of detail, from expressions and method calls to individual variables.
The Insert a Counter form should appear similar to the following image.
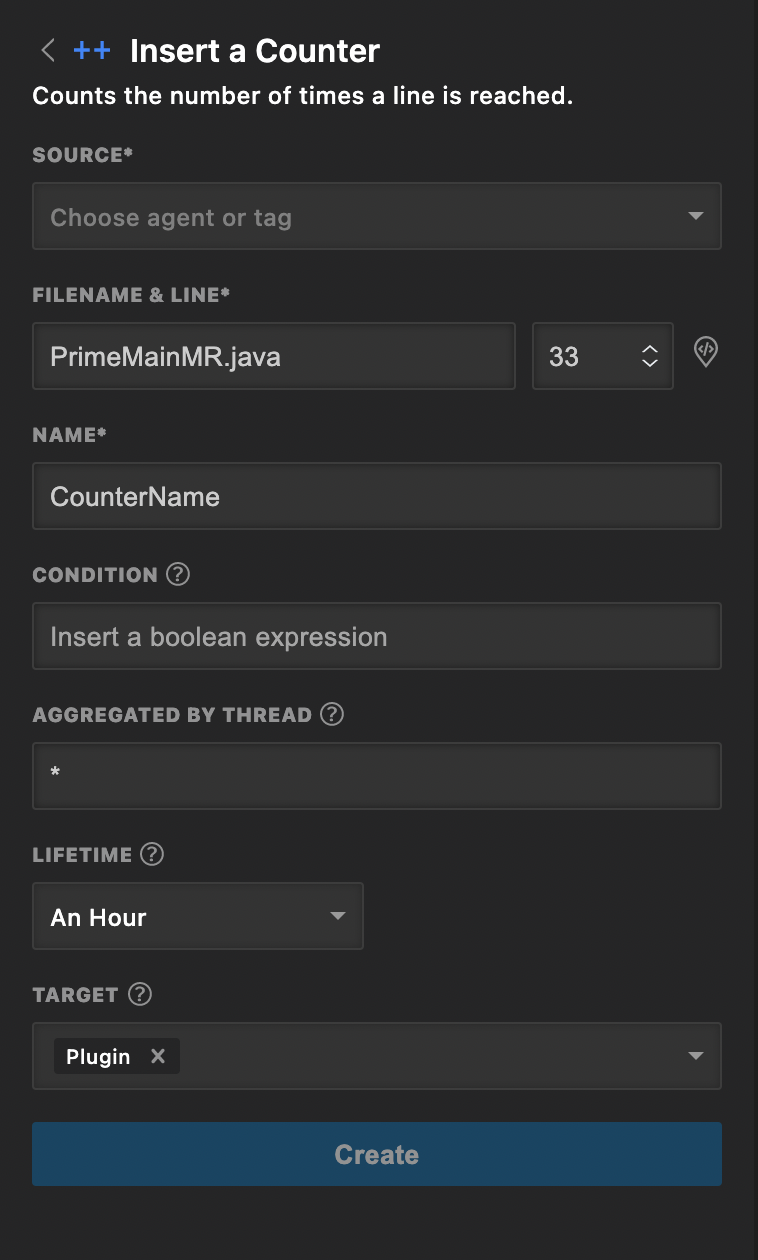
The following table describes the available configuration options.
| Fields | Description |
|---|---|
| SOURCE | From the available options in the dropdown list, bind the action to a specific agent or tag. |
| FILENAME & LINE | The source code file into which you're inserting the action. The default path is to the source code file from which you're currently working. Use the up/down arrows to change the line number for inserting the counter. |
| NAME | A meaningful label for the metric. |
| CONDITION | The condition of an if statement, used to limit the execution of the action. The condition myVar % 7 == 0 limits the action (log, snapshot, metric) output so that it only prints for variables that are divisible by 7. |
| AGGREGATED BY THREAD | Group the metric based on thread names. Specify the required thread name prefix, followed by an asterisk. - If you specify just *, the counter increments for all threads that reach a given line of code (the same as the default).- If you specify mythread*, all threads with the prefix mythread are considered as a single group; the counter increments only if a member of the mythread* group reaches the given line of code. |
| LIFETIME | The time after which the action ceases to track code behavior and is automatically disabled; default = 1 hour. |
| TARGET | Select your preferred action output taget. You can pick either: - Stdout - Metricss are routed only to your application's standard output. - Plugin - Metrics appear in the Lightrun Console, the Lightrun Management Portal, and configured integrations. or both options at once. |
Tip
Clicking the Get filename & line  icon automatically loads the file name and line number at which the cursor currently is positioned within the VS Code editor.
Note
Metrics (standard and custom) continue to be published every few seconds, even if the code didn't reach the code line where the metric is inserted.
Tic & Toc🔗
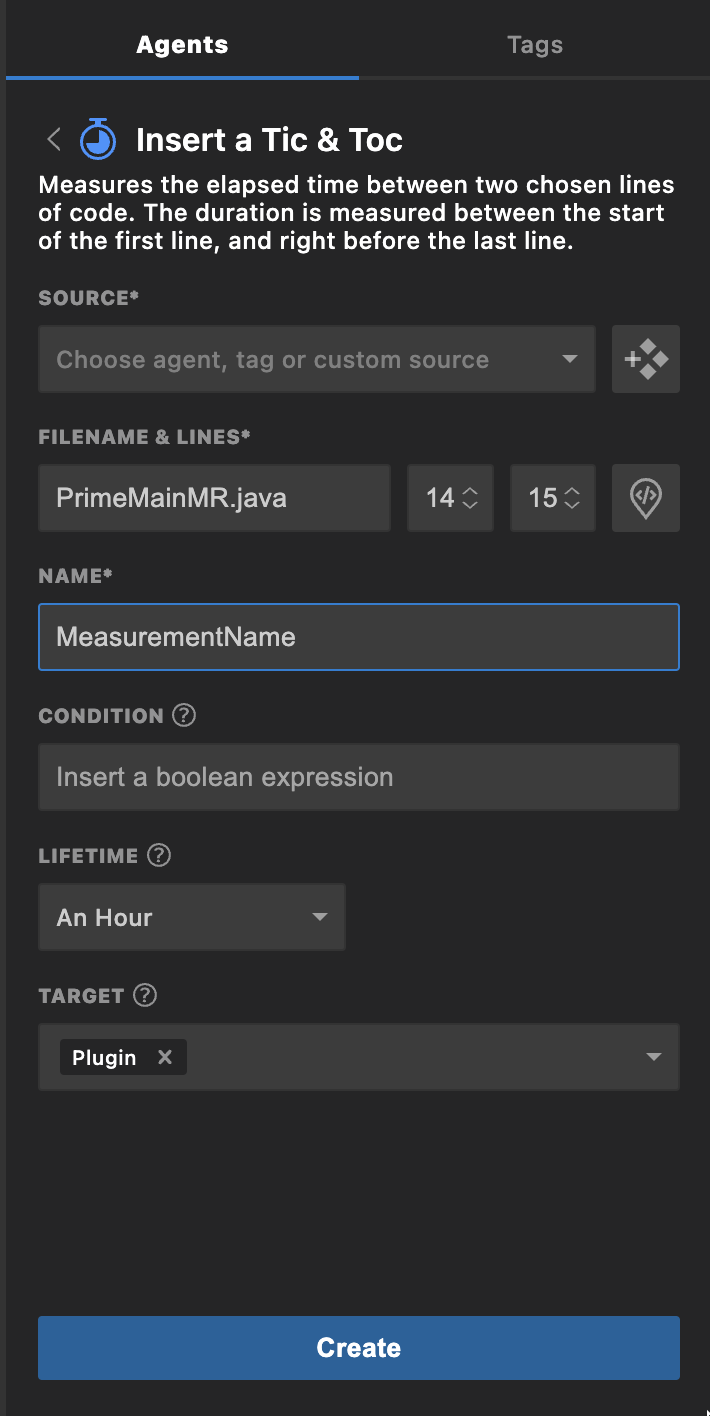
The Tic & Toc metric measures the elapsed time of code execution between two specified lines, Tic (start line) and Toc (end line), in the same code block.
The Insert a Tic & Toc form should appear similar to the following image.
Note
The Tic (start line) and Toc (end line) both must be positioned inside the same code block.
The following table describes the available configuration options.
| Fields | Description |
|---|---|
| SOURCE | From the available options in the dropdown list, bind the action to a specific agent or tag. |
| FILENAME & LINE | The source code file into which you're inserting the action. The default path is to the source code file from which you're currently working. Use the up/down arrows to change the line number for inserting the counter. |
| NAME | A meaningful label for the metric. |
| CONDITION | The condition of an if statement, used to limit the execution of the action. The condition myVar % 7 == 0 limits the action (log, snapshot, metric) output so that it only prints for variables that are divisible by 7. |
| LIFETIME | The time after which the action ceases to track code behavior and is automatically disabled; default = 1 hour. |
| TARGET | Select your preferred action output taget. You can pick either: - Stdout - Metrics are routed only to your application's standard output. - Plugin - Metrics appear in the Lightrun Console, the Lightrun Management Portal, and configured integrations. or both options at once. |
Tip
Clicking the Get filename & line icon automatically loads the file name and line number at which the cursor currently is positioned within the VS Code editor.
Note
Metrics (standard and custom) continue to be published every few seconds, even if the code didn't reach the code line where the metric is inserted.
Custom Metric🔗
You can insert your own customized metrics expressions that evaluate to a long integer result.
The Insert a Custom Metric form should appear similar to the following image.
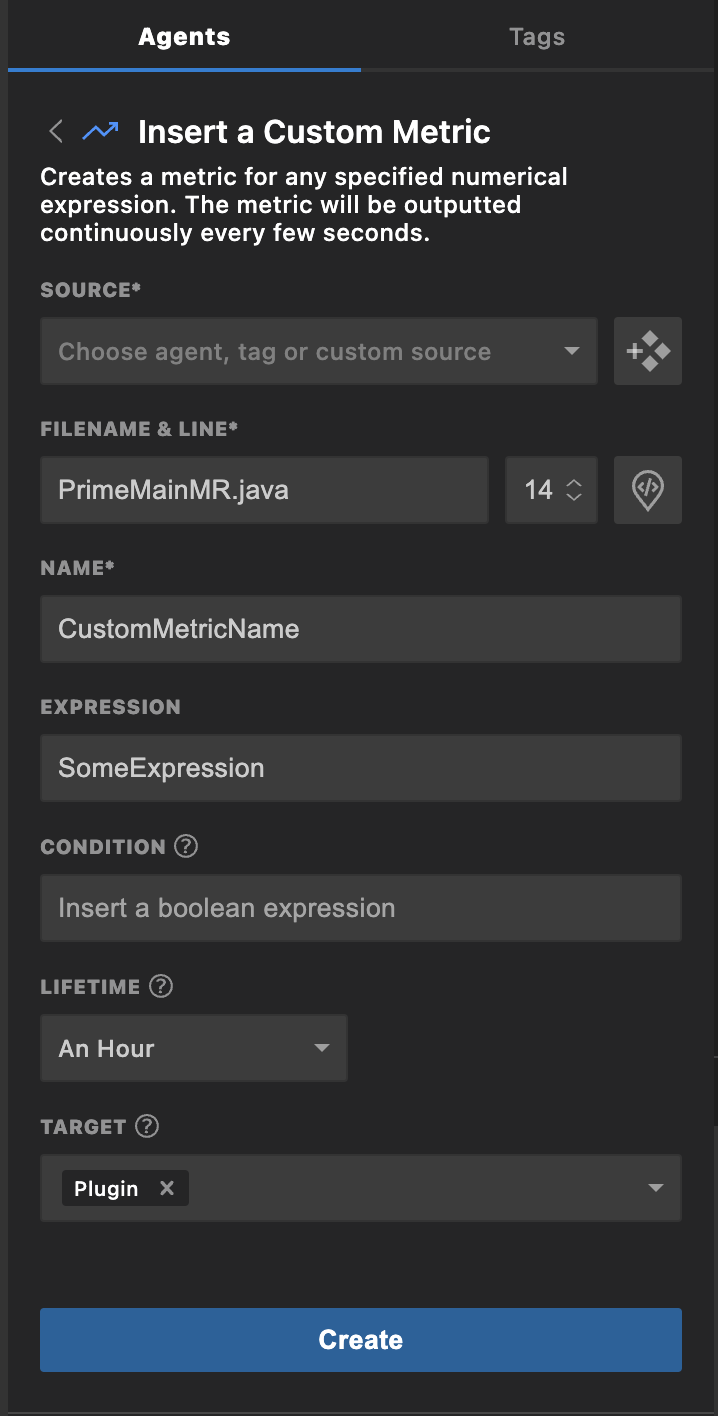
The following table describes the available configuration options.
| Fields | Description |
|---|---|
| SOURCE | From the available options in the dropdown list, bind the action to a specific agent or tag. |
| FILENAME & LINE | The source code file into which you're inserting the action. The default path is to the source code file from which you're currently working. Use the up/down arrows to change the line number for inserting the counter. |
| NAME | A meaningful label for the metric. |
| EXPRESSION | Any expression - simple or complex - that evaluates to a numerical result. |
| CONDITION | The condition of an if statement, used to limit the execution of the action. The condition myVar % 7 == 0 limits the action (log, snapshot, metric) output so that it only prints for variables that are divisible by 7. |
| LIFETIME | The time after which the action ceases to track code behavior and is automatically disabled; default = 1 hour. |
| TARGET | Select your preferred action output taget. You can pick either: - Stdout - Metric s are routed only to your application's standard output. - Plugin - Metrics appear in the Lightrun Console, the Lightrun Management Portal, and configured integrations. or both options at once. |
Tip
Clicking the Get filename & line icon automatically loads the file name and line number at which the cursor currently is positioned within the VS Code editor.
Note
Metrics (standard and custom) continue to be published every few seconds, even if the code didn't reach the code line where the metric is inserted.
Manage metrics🔗
Once a Lightrun metric has been inserted into your application,
- A new metric action will appear under the selected source (agent or tag) in the Lightrun sidebar.
- A metric icon will appear next to the selected code line. See the table below for each metric and their icons.
| Metric | Icon |
|---|---|
| Counter | |
| Tic & Toc | |
| Custom Metric |
You can view, disable, or delete a metric directly in your VS Code IDE.
Note
Metrics cannot be edited.
To view a metric action configuration🔗
-
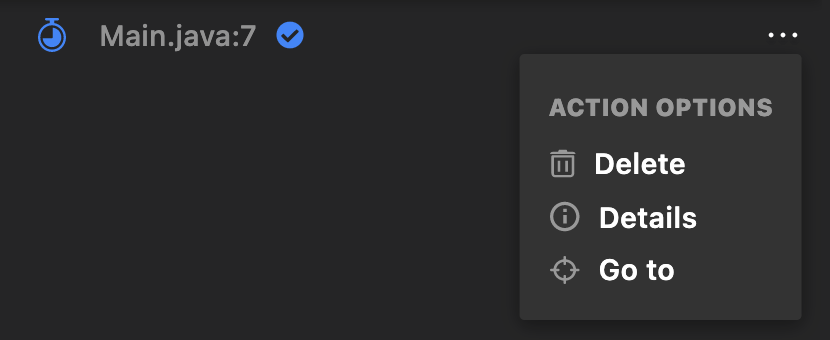
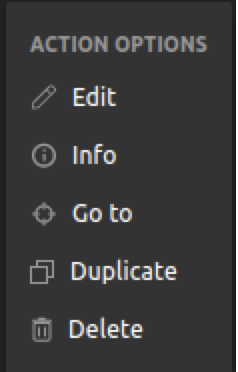
Click the menu icon ... next to the relevant metric in the Lightrun sidebar to open the ACTION OPTIONS menu.
-
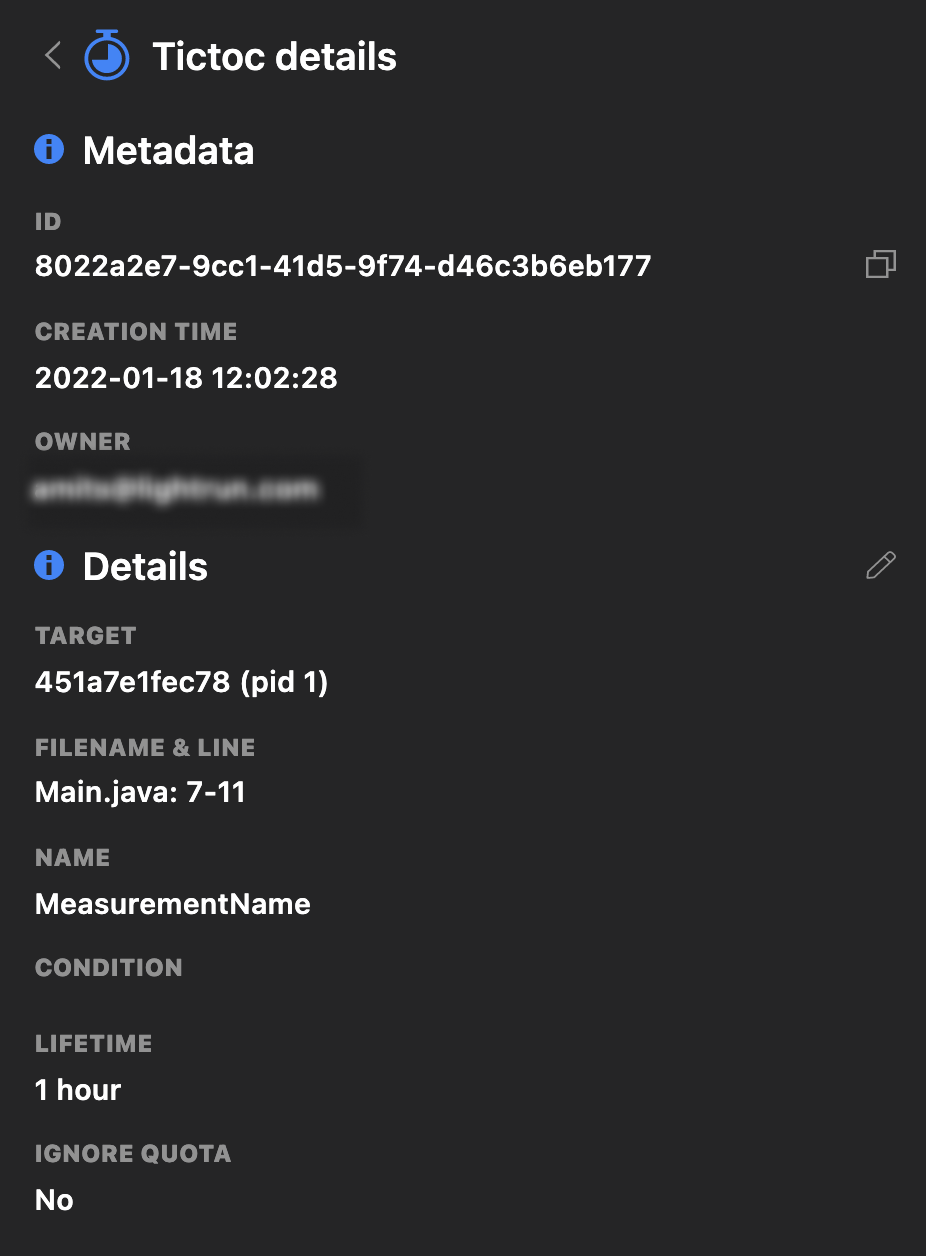
Select Details to open the metric details panel. The metric details panel should appear similar to the following image. (details for the Tic & Toc action is shown below).
To disable a metric action🔗
- Hover your cursor over the relevant metric in the Lightrun sidebar.
A toggle switch should appear.

- Click the toggle switch from blue (on) to grey (off).
- To resume metrics, click the toggle back to blue.
Duplicate a metric action🔗
- Hover your cursor over the relevant metric in the Lightrun sidebar.
-
Right-click and select Duplicate.
-
Go to the selected destination and right-click and select Duplicate.
Copy and paste a counter or a custom metric🔗
-
Go to the line in your application source that contains the counter or custom metric to be copied. Make sure to use the source code version currently deployed to your remote app (where the agent is attached).
-
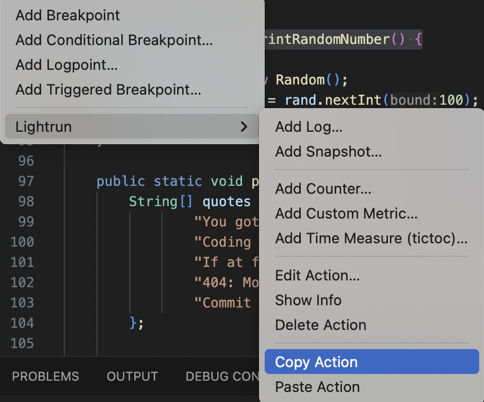
Right-click to open the VS Code context menu.
-
From the VS Code context menu, click Lightrun.
The VS Code Command Palette opens with a list of Lightrun plugin options.
-
From the Command Palette, select Copy Action.
-
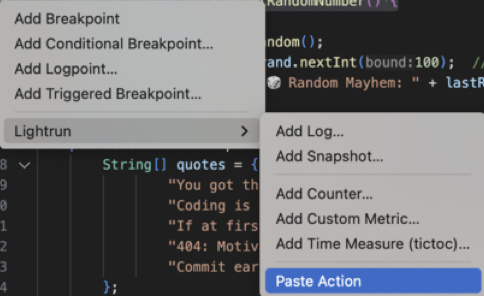
Go to the line inyour applicationsource code where you'd like to paste the copied metric.
Delete a metric action🔗
-
Click the menu icon ... next to the relevant metric in the Lightrun sidebar to open the ACTION OPTIONS menu.
-
Select Delete to delete the metric action.
Understanding metrics data🔗
Counter🔗
An example Lightrun Counter output is shown in the code sample below:
CounterData Log{counterId='9b1e6b80-b5ec-42dd-b411-28bbb3e44059', name=counter1::*, count=751, m1_rate=49.51307448246653, m5_rate=53.94779140968095, m15_rate=54.77571845490024, mean_rate=35.71689054874403}
The following table describes the data present in a Counter output.
| Column | Description |
|---|---|
| counterId | A unique identifier assigned to the counter by the system. |
| name | The counter label. |
| count | The number of times the specified code was executed (hit count). |
| m1_rate | The average amount of counter metrics hit recorded per second for one minute. |
| m5_rate | The average amount of counter metrics hit recorded per second for five minutes. |
| m15_rate | The average amount of counter metrics hit recorded per second for fifteen minutes. |
| mean_rate | The mean rate of hits recorded per second during the entire duration of the Lightrun action. |
Time measurements🔗
An example Lightrun Time measurement output is shown in the code sample below:
TicToc Log {TicTocId='670a505f-33c1-4c8c-846b-57afaa9a236c', name='MeasurementName', count='17', max='5', min='0', mean='0.46618461992518356', stddev='1.1864864756822397'}
The following table describes the data present in a Time measurement output.
| Column | Description |
|---|---|
| TicTocId | A unique identifier assigned to the time measurement by the system. |
| name | The time measurement label. |
| count | The number of times the specified code was executed. |
| max | Maximum amount of time measured by the time measurement metric in milliseconds. |
| min | Minimum amount of time measured by the time measurement metric in milliseconds. |
| mean | Mean amount of time measured by the time measurement metric in milliseconds. |
| stddev | Standard deviation of the times recorded by the time measurement metric. |
Note
- When you create a time measurement metric, Lightrun measures the execution time of the code you’ve selected not just once but every time a thread passes through the specified code. For various reasons, like the CPU being busy with different things at a time, this often results in a slightly different execution time for each code invocation. Lightrun’s time measurement metrics data includes not just one number but enough data to understand how much time is spent in that part of your code.
- Lightrun time measurement metrics output is not displayed for each invocation; instead, the recorded time measurement data is sent to your configured output target (Plugin or Stdout) every second. This ensures that the system collecting and processing the data, typically a time series database like Prometheus, will have a constant stream of data to process. This also means you’ll see Time measurements data being produced regularly, even when the code isn’t executed.