View Lightrun snapshot data in the Lightrun Management Portal🔗
As your team works with Lightrun, they can dynamically insert snapshots to track information based on a variety of conditions.
Once a snapshot is inserted into the application, its stacktrace can be viewed in the IDE or from the Lightrun Management Portal in your browser. You can learn more about Lightrun Snapshots here.
Starting from version 1.63, you can filter for snapshot hits by Action ID or free-text search.
View snapshot hit data🔗
- Log in to your Lightrun account.
- Navigate to Data explorer.
-
Select Snapshots.
The Snapshot page opens.
The page contains the following tables:
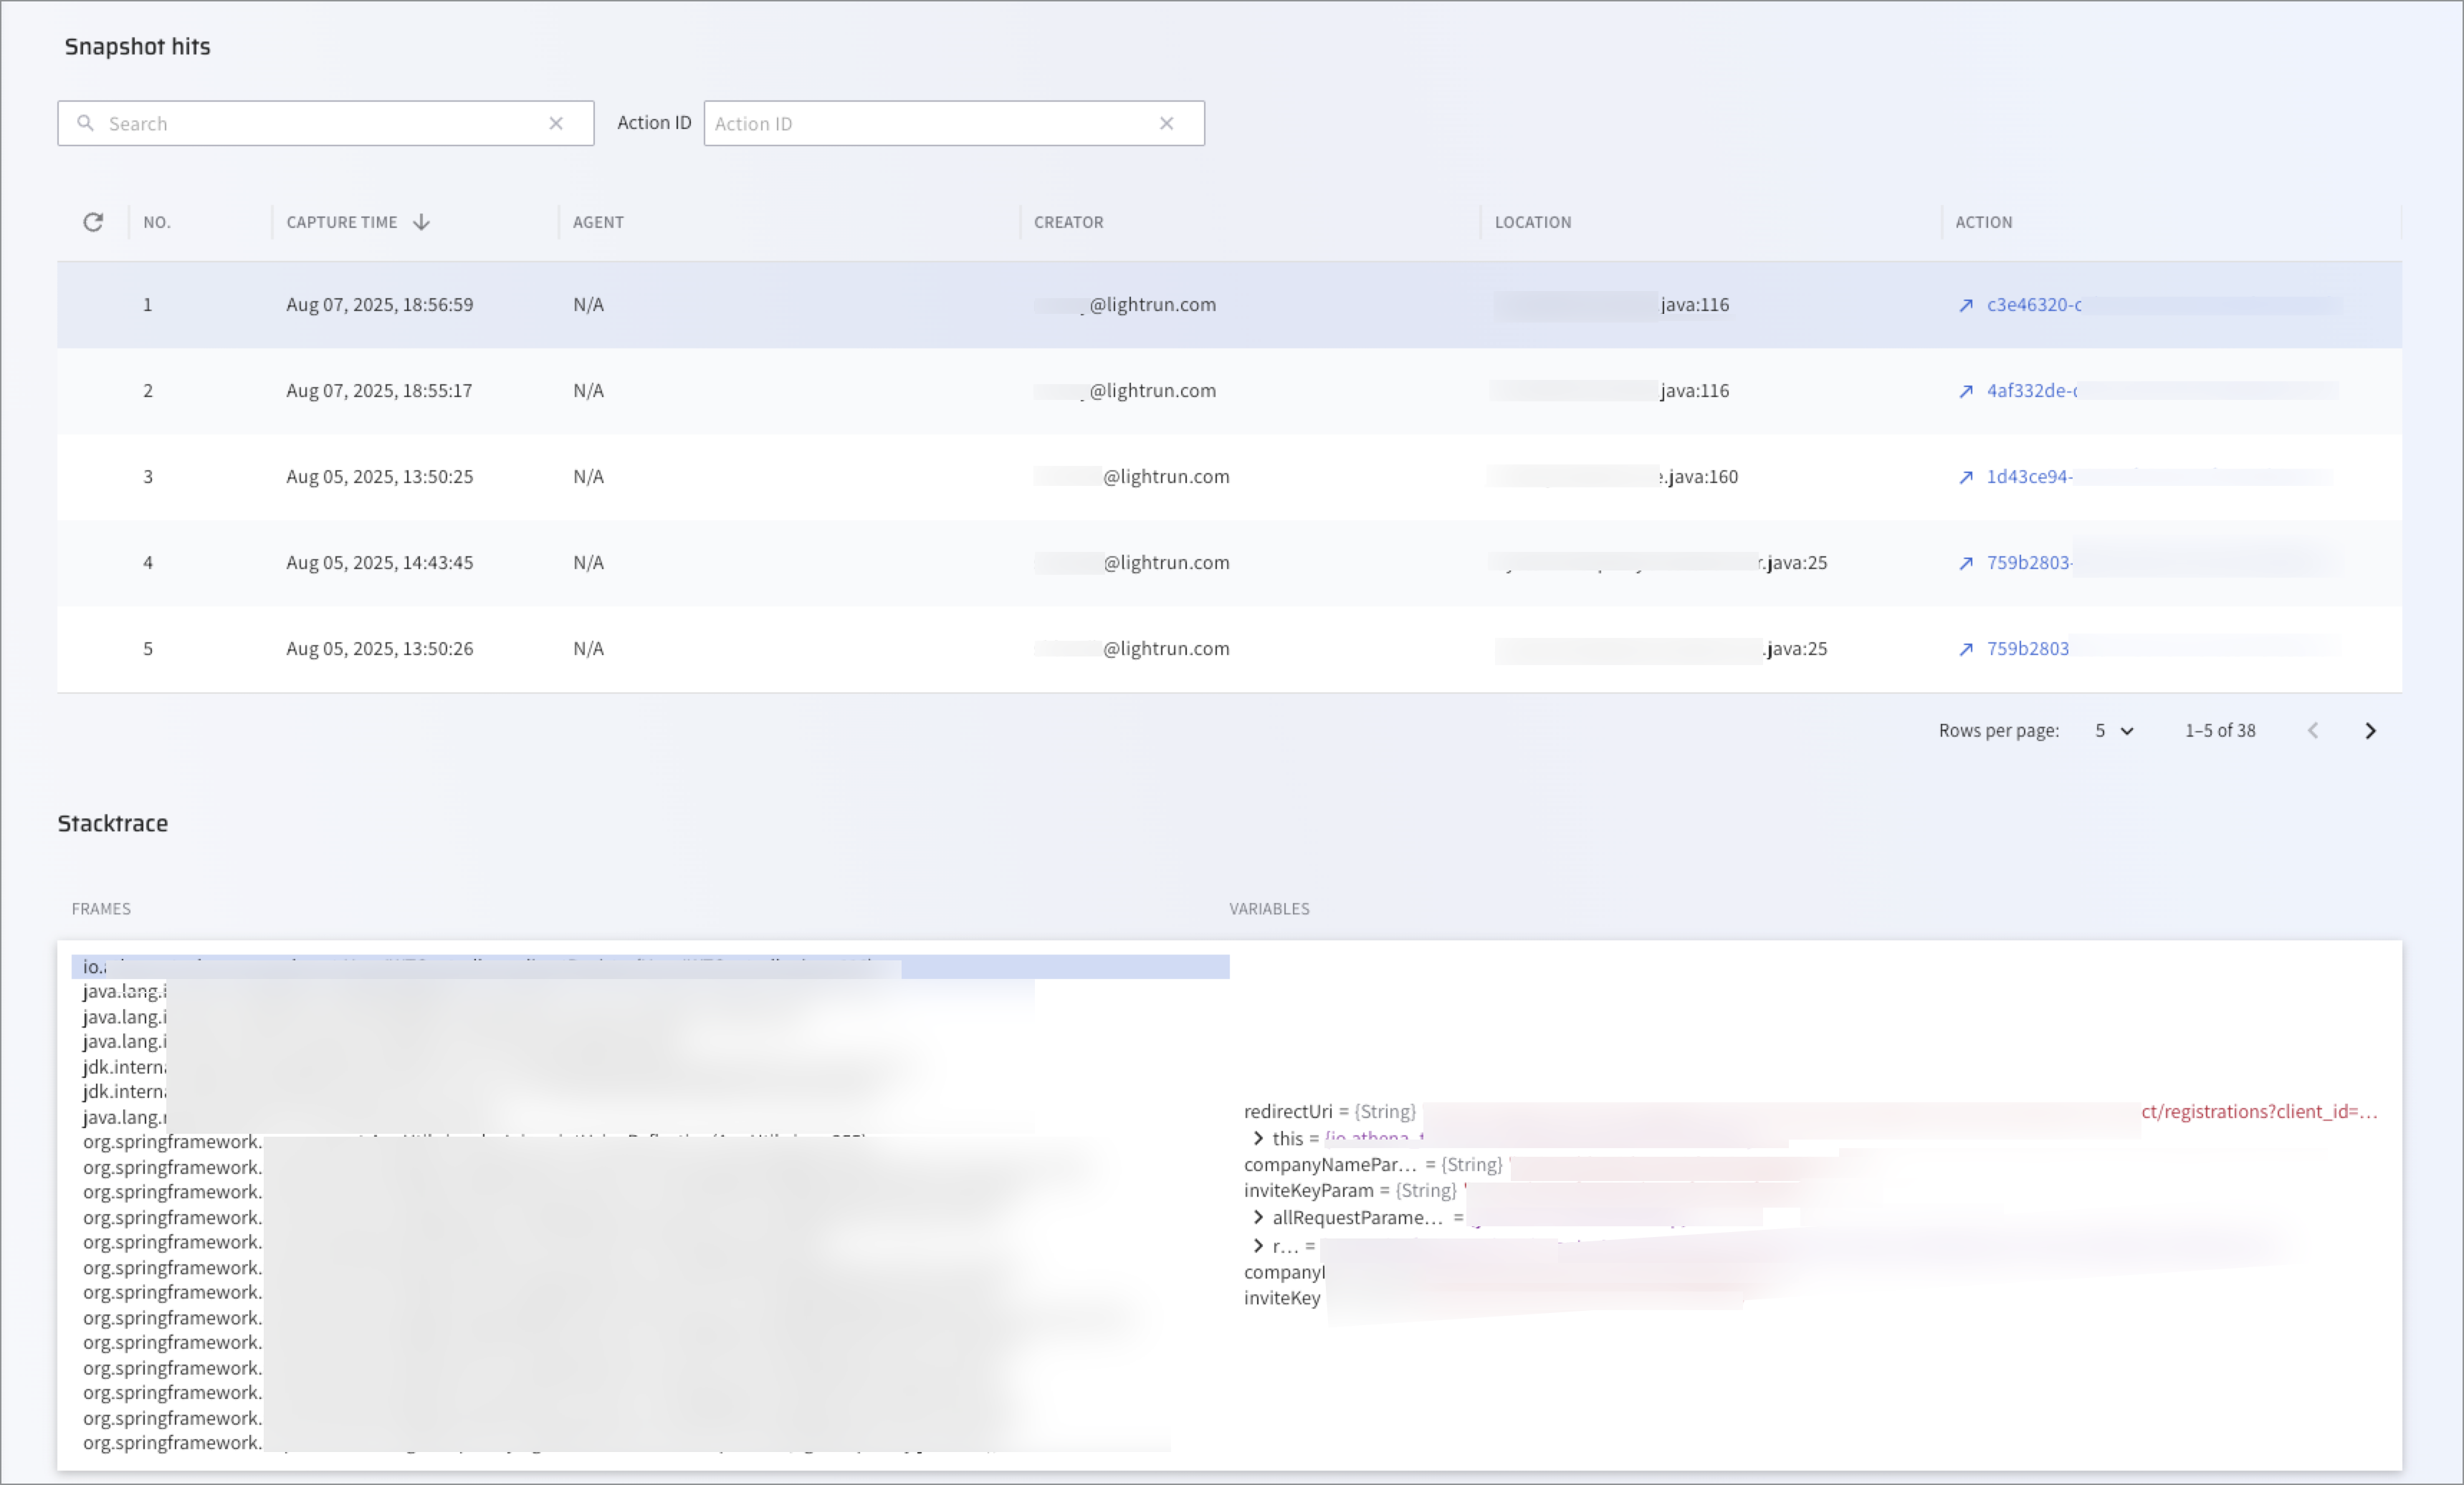
- Snapshot hits: Displays a list of snapshots and their creation details appears.
- Stacktrace: Stacktrace details by frames and variables.
The following table describes the data available in the first table:
Column Description NO. The unique identifier assigned to the snapshot by the system CAPTURE TIME The time at which the snapshot was actually taken. AGENT The agent or tag to which the snapshot was attached. CREATOR The user who inserted the snapshot. LOCATION The line of code at which the snapshot was inserted. ACTION ID Each Action gets an ID that can be found through the filter.
View snapshot stacktrace frames and variable data🔗
- Click on a snapshot to view the stacktrace data in the Stacktrace details table.
The following table describes the data in the Stacktrace details table.
Column Description FRAMES Each frame represents a method call in the stacktrace. VARIABLES Displays all related details for the selection in the Frame column.
Last update: February 8, 2026