Work with Lightrun Metrics in the JetBrains IDE🔗
Overview🔗
Support
Lightrun metrics are only available for Java/JVM applications.
The Lightrun plugin for the IntelliJ IDEA provides four different metrics for monitoring the performance of your code and identifying issues:
- Counters - Count the number of times a specific line of code is reached
- Tic & Toc - Measure the elapsed time between two selected lines of code within a function
- Method Duration - Measure the elapsed time for a method to execute
- Custom Metrics - Create customized metrics, using parameters and simple or complex expressions that return a
long intresult
The following subsections describe, for each Lightrun metric, the procedures for:
Prerequisites
To use the plugin, make sure you have:
- Installed the plugin in your local IntelliJ instance.
- Authenticated IntelliJ with your Lightrun account.
- Attached at least one agent to your app.
- Opened the source code file for the running application from the IDE.
Adding metrics🔗
Counters🔗
A Lightrun Counter counts the number of times a specified line of code is reached and outputs the data periodically to the configured action target.
With a Lightrun Counter output, you can obtain a deeper insight into the state of your application's code, at any level of detail, from expressions and method calls to individual variables.
To insert a Counter into your code🔗
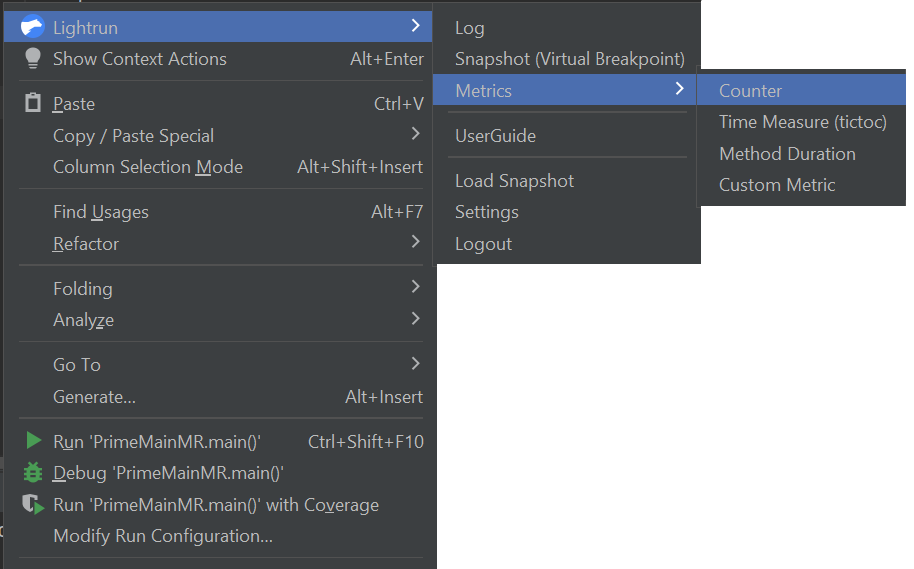
- Place your cursor at the line in your source code where you want to insert the Counter, and Right-click to open the context menu
- Hover over Lightrun and, from the Metrics menu, select Counter.
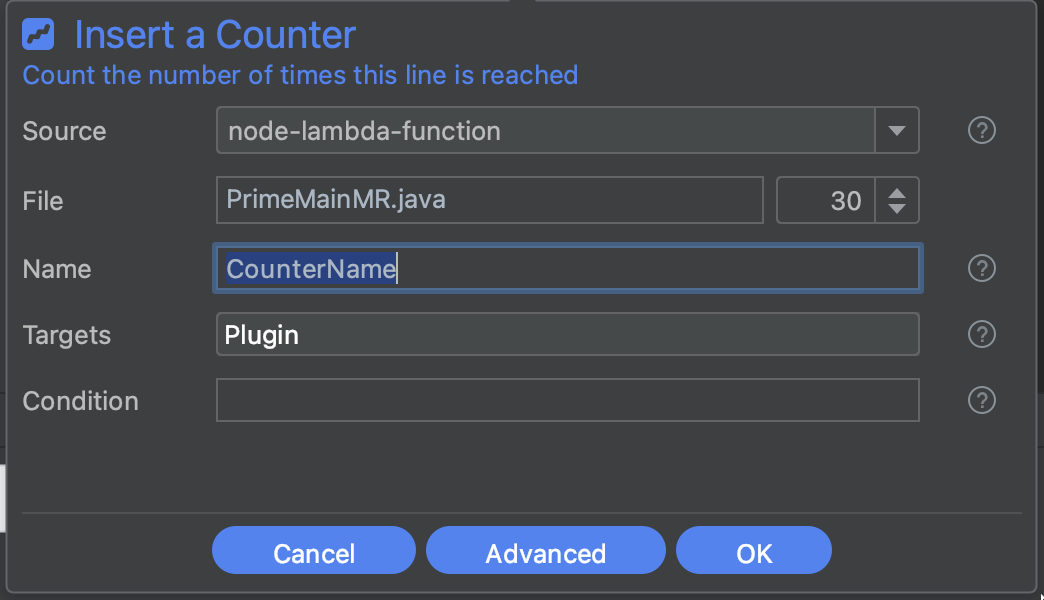
 The Create Counter dialog should appear similar to the following image.
-
Complete the fields in the dialog as follows:
Fields Description SOURCE From the available options in the dropdown list, bind the action to a specific agent or tag. FILE The source code file into which you're inserting the action. The default path is to the source code file from which you're currently working.
Use the up/down arrows to change the line number for inserting the counter.NAME A meaningful label for the metric. TARGETS Select your preferred action output target. You can pick either:
- Stdout - Metrics are routed only to your application's standard output.
- Plugin - Metrics appear in the Lightrun Console and configured integrations.
or both options at once.CONDITION The condition of an ifstatement, used to limit the execution of the action.
For example, The conditionmyVar % 7 == 0limits the action (log, snapshot, metric) output so that it only prints for variables that are divisible by 7. -
Click Advanced to configure the following additional fields:
Fields Description AGGREGATED BY Group the metric based on thread names. Specify the required thread name prefix, followed by an asterisk. IGNORE QUOTA The quota (rate limit) is configured by the agent configurations.
Only users withIGNORE_QUOTArole can override an agent's quota limitation, theIGNORE_QUOTAcheckbox is disabled for other users.EXPIRY The time after which the action ceases to track code behavior and is automatically disabled; default = 1 hour. -
Click OK to add the Counter metric to your code. A
 icon should appear in the left gutter of the editor next to the code line where the action was added.
Time measures🔗
There are two varieties of time measure metrics in Lightrun:
- Method Duration - The Method Duration metric measures the elapsed time during the execution of a method (function), from the entry through a method call to the exit from the return expression.
- Tic & Toc - The Tic & Toc metric measures the elapsed time of code execution between two specified lines, Tic (start line) and Toc (end line), in the same code block.
Note
The Tic (start line) and Toc (end line) both must be positioned inside the same code block.
To insert a Method Duration into your code🔗
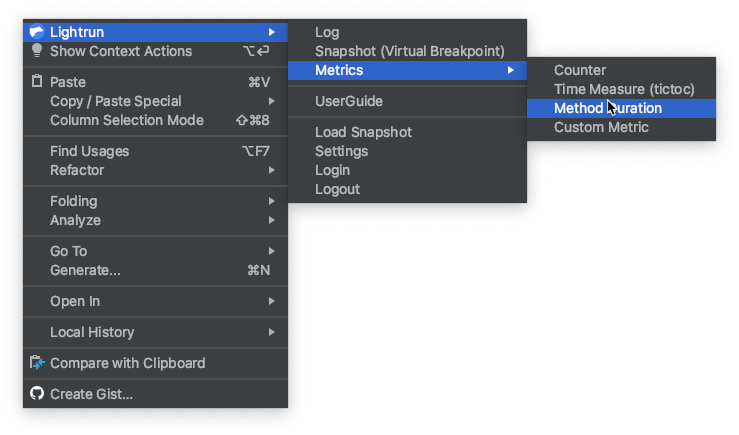
- Go to the line of your source code where the method is declared, and Right-click to open the context menu.
- Hover over Lightrun and, from the Metrics menu, click Method Duration.
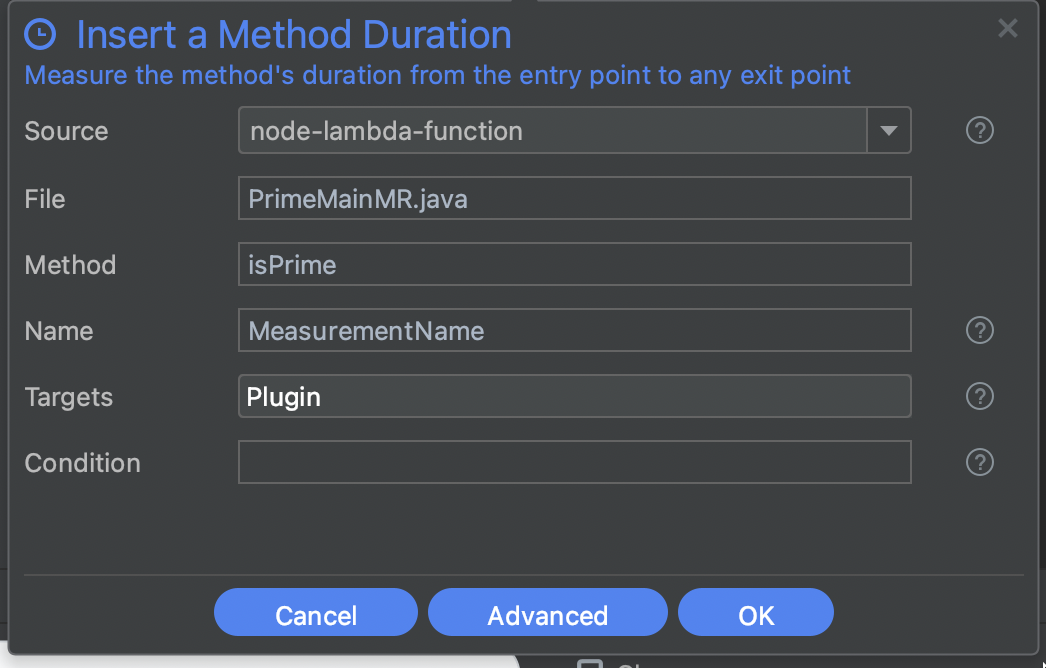
 The Create Measure Duration dialog should appear similar to the following image.
-
Complete the fields in the dialog as follows:
Fields Description SOURCE From the available options in the dropdown list, bind the action to a specific agent or tag. FILE The source code file into which you're inserting the action. The default path is to the source code file from which you're currently working.
Use the up/down arrows to change the line number for inserting the counter.NAME A meaningful label for the metric. METHOD The name of the method (function) to which the Method Duration metric is to be applied. TARGETS Select your preferred action output target. You can pick either:
- Stdout - Metrics are routed only to your application's standard output.
- Plugin - Metrics appear in the Lightrun Console and configured integrations.
or both options at once.CONDITION The condition of an ifstatement, used to limit the execution of the action.
For example, The conditionmyVar % 7 == 0limits the action (log, snapshot, metric) output so that it only prints for variables that are divisible by 7. -
Click Advanced, to configure the following additional fields:
Fields Description IGNORE QUOTA The quota (rate limit) is configured by the agent configurations.
Only users withIGNORE_QUOTArole can override an agent's quota limitation, theIGNORE_QUOTAcheckbox is disabled for other users.EXPIRY The time after which the action ceases to track code behavior and is automatically disabled; default = 1 hour. -
Click OK to add the Method Duration metric to your code. A
 icon should appear in the left gutter of the editor, next to the code line where the action was added.
To insert a Tic & Toc into your code🔗
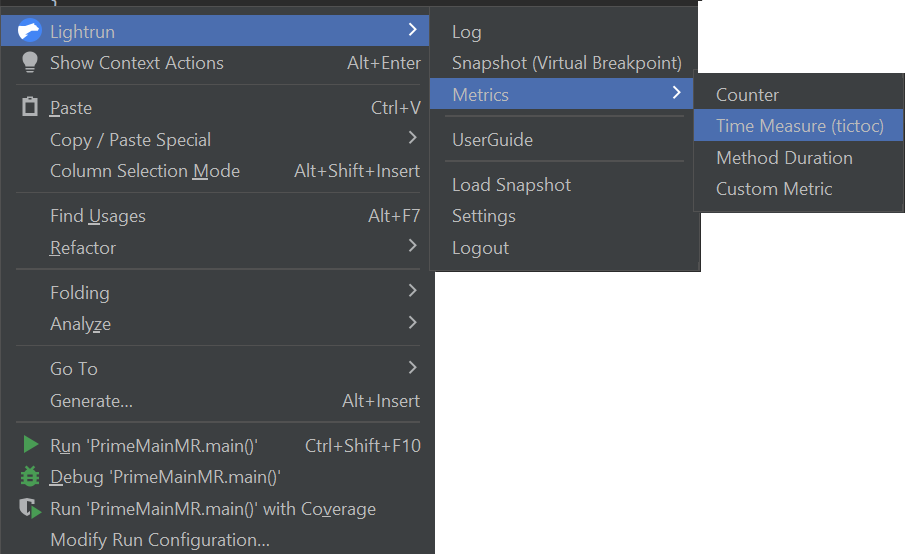
- Place your cursor at the code line in the code block where you'd like to insert the Tic & Toc, and Right-click to open the context menu.
- Hover over Lightrun and, from the Metrics menu, click Time measure (tictoc).
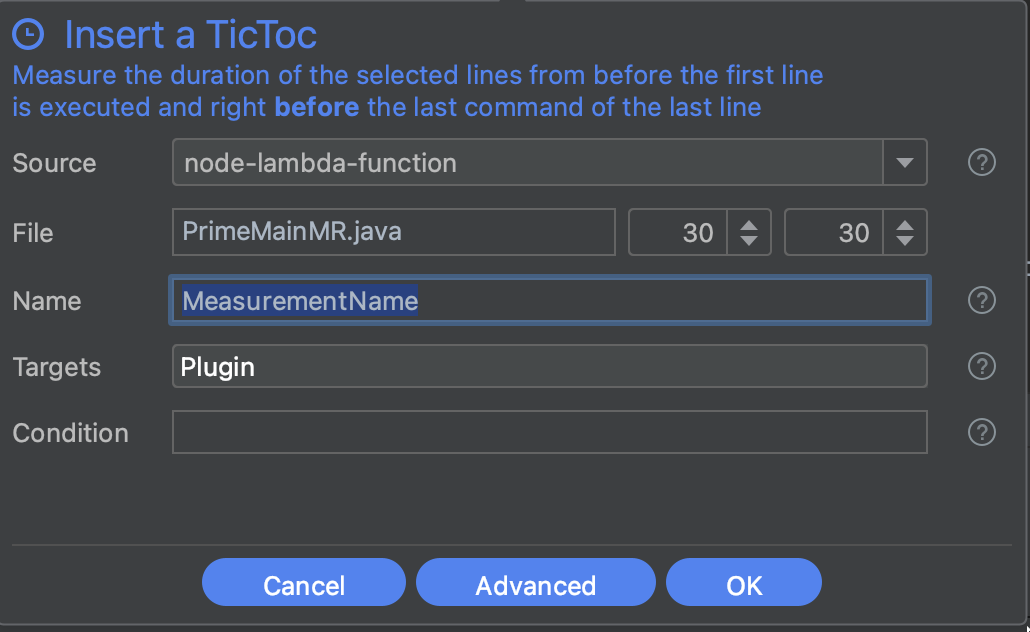
 The Create Time Duration (tictoc) form should appear similar to the following image.
-
Complete the fields in the dialog as follows:
Fields Description SOURCE From the available options in the dropdown list, bind the action to a specific agent or tag. FILE The source code file into which you're inserting the action. The default path is to the source code file from which you're currently working.
Use the up/down arrows to change the line number for inserting the counter.NAME A meaningful label for the metric. TARGETS Select your preferred action output target. You can pick either:
- Stdout - Metricss are routed only to your application's standard output.
- Plugin - Metrics appear in the Lightrun Console and configured integrations.
or both options at once.CONDITION The condition of an ifstatement, used to limit the execution of the action.
For example, The conditionmyVar % 7 == 0limits the action (log, snapshot, metric) output so that it only prints for variables that are divisible by 7. -
Click Advanced, to configure the following additional fields:
Fields Description IGNORE QUOTA The quota (rate limit) is configured by the agent configurations.
Only users withIGNORE_QUOTArole can override an agent's quota limitation, theIGNORE_QUOTAcheckbox is disabled for other users.EXPIRY The time after which the action ceases to track code behavior and is automatically disabled; default = 1 hour. -
Click OK to add the Tic & Toc metric to your code. A
icon should appear in the left gutter of the editor, next to the code line where the action was added.
Custom Metrics🔗
You can insert your own customized metrics expressions that evaluate to a long integer result.
To insert a Custom Metric into your code🔗
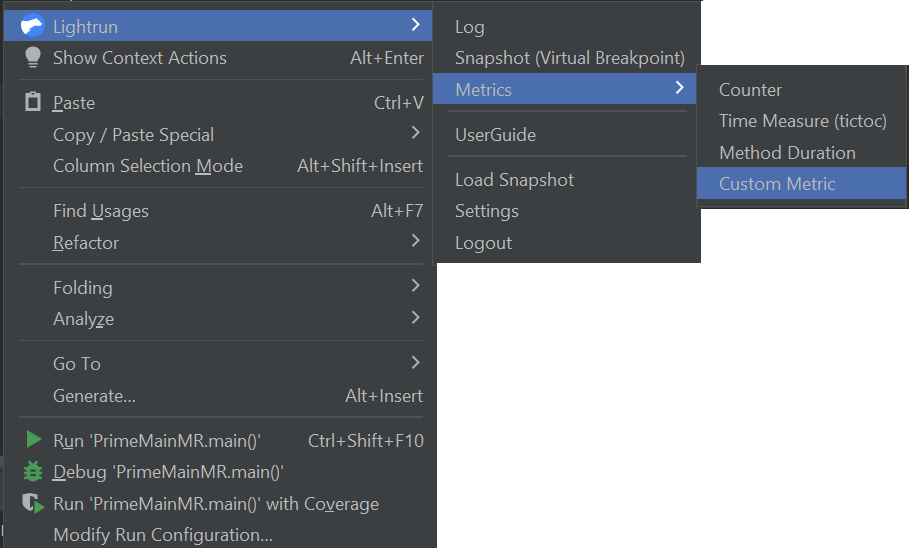
- Place your cursor at the line in your source code where you want to insert the Custom Metric, and Right-click to open the context menu
- Hover over Lightrun and, from the Metrics menu, click Custom Metric.
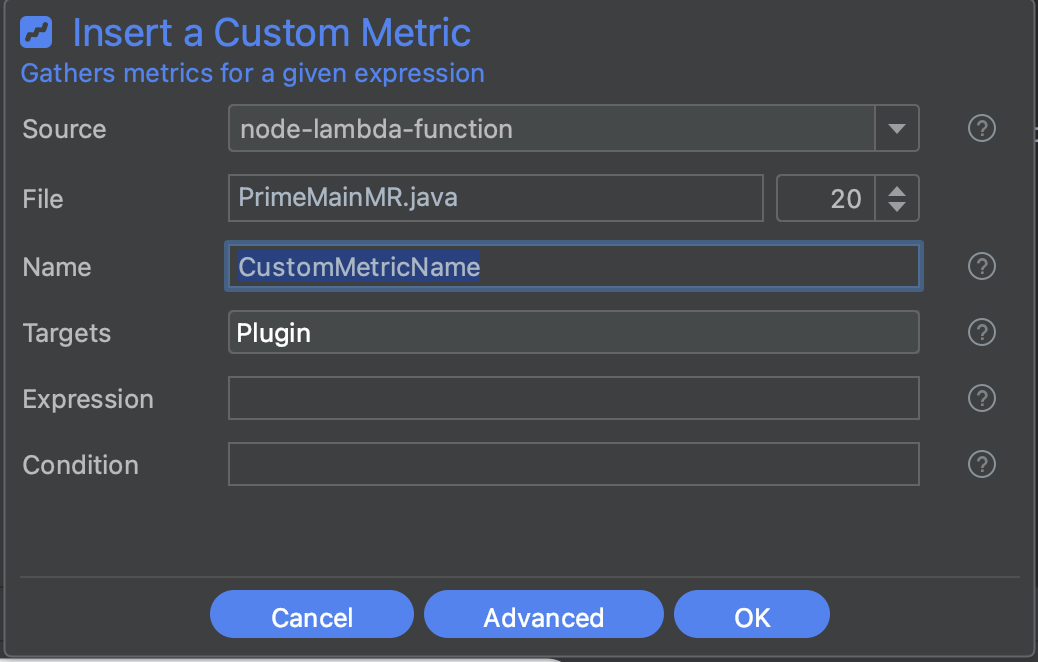
 The Create Custom Metric dialog should appear similar to the following image.
-
Complete the fields in the dialog as follows:
Fields Description SOURCE From the available options in the dropdown list, bind the action to a specific agent or tag. FILENAME & LINE The source code file into which you're inserting the action. The default path is to the source code file from which you're currently working.
Use the up/down arrows to change the line number for inserting the counter.NAME A meaningful label for the metric. TARGETS Select your preferred action output target. You can pick either:
- Stdout - Metrics are routed only to your application's standard output.
- Plugin - Metrics appear in the Lightrun Console and configured integrations.
or both options at once.EXPRESSION Any expression - simple or complex - that evaluates to a numerical result. CONDITION The condition of an ifstatement, used to limit the execution of the action. -
Click Advanced, to configure the following additional fields:
Fields Description IGNORE QUOTA The quota (rate limit) is configured by the agent configurations.
Only users withIGNORE_QUOTArole can override an agent's quota limitation, theIGNORE_QUOTAcheckbox is disabled for other users.EXPIRY The time after which the action ceases to track code behavior and is automatically disabled; default = 1 hour. -
Click OK to add the Custom Metric to your code. A Custom Metric icon
should appear in the left gutter of the editor, next to the code line where the action was added.
Managing metrics🔗
Once you've added a metric, you can:
- Hover over a metrics icon in the editor gutter, to view summary information in a tooltip.
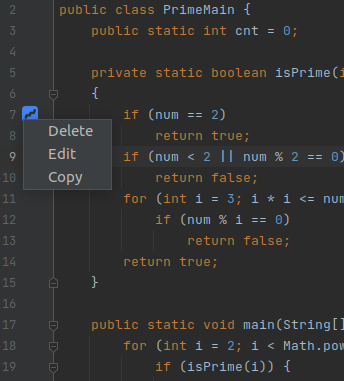
- Right-click any icon in the gutter to delete or view details.
- Right-click on a metric in the editor gutter to copy and then paste the metric in the new location.
Note
Because a metric's state is persistent during its lifetime (including between successive runs of the applications), they cannot be edited. A configuration modification requires the creation of a new metric.
TO EDIT METRIC CONFIGURATION PARAMETERS🔗
An action that was edited is considered a new action and therefore any data collected prior to editing the action will not be included in the new action.
- Right-click the metric marker to edit the metric action.
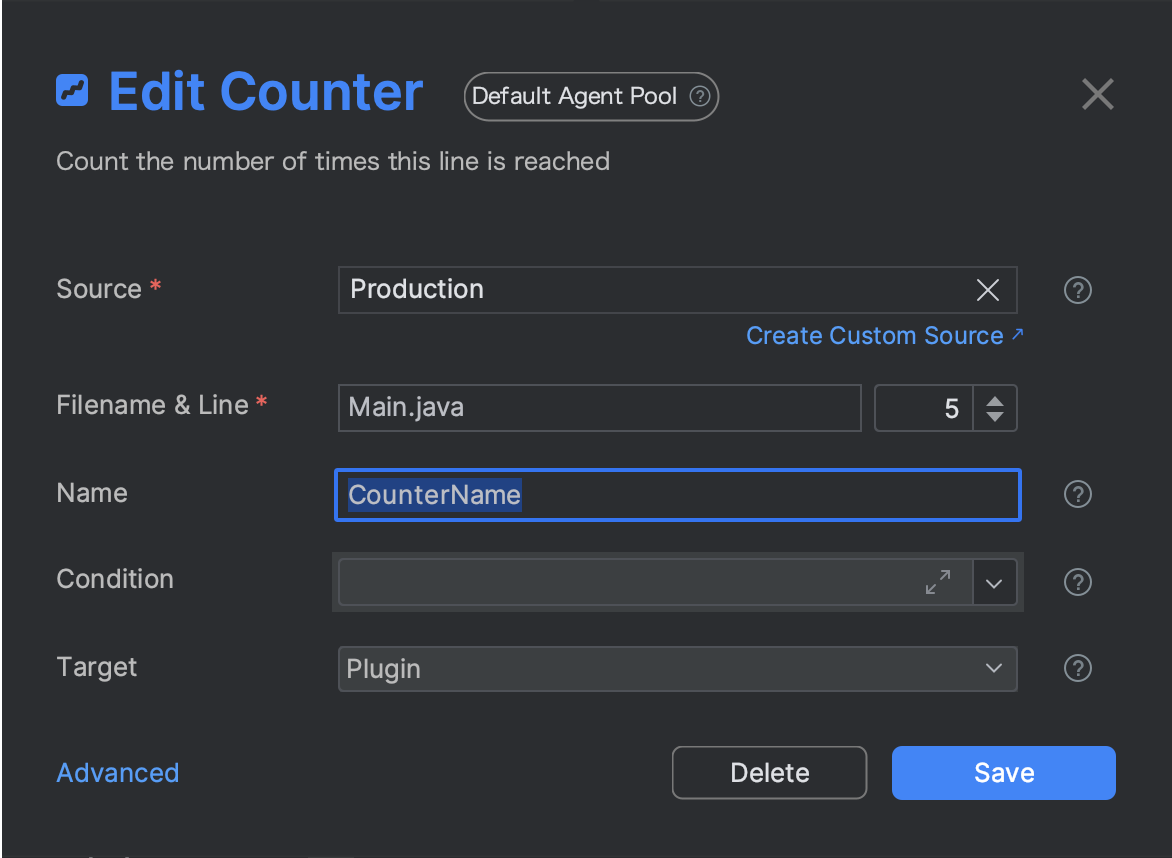
- Apply your changes and click Save.
TO COPY AND PASTE METRICS🔗
This procedure allows you to easily reuse existing Metrics in multiple locations within your code.
Note
Tic Toc Metric guideline: You manually need to update the Toc (end line) for Tic Toc metric when you paste the metric, as the Tic (start line) and Toc (end line) are identical.
- Go to the line in your application source code where you'd like to copy the metric.
- Click Copy to copy the metric settings.
- Go to the line of your target source code at which you'd like to insert the copied metric, right-click and click Paste
. For example, Paste Counter. 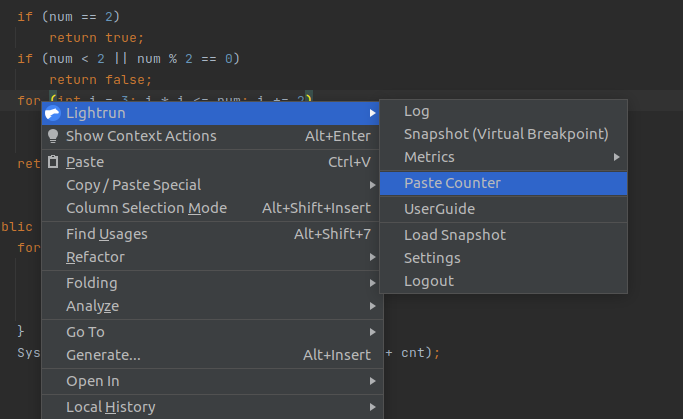 The Insert a Counter dialog opens with the copied metric settings.
 - Provide a new name for the metric and click Okay.
Analyzing metrics🔗
Once a metric hit has been captured, you can view and analyze the captured hit in two places in your JetBrains IDE.
Lightrun Metrics tool window🔗
The Lightrun Metrics tool window is a dedicated tool window provided by Lightrun for visualizing captured metrics hits directly in your JetBrains IDE. To open the tool window, click on Lightrun Metrics in the bottom part of your JetBrains IDE. The Lightrun Metrics tool window should appear similar to the following image.
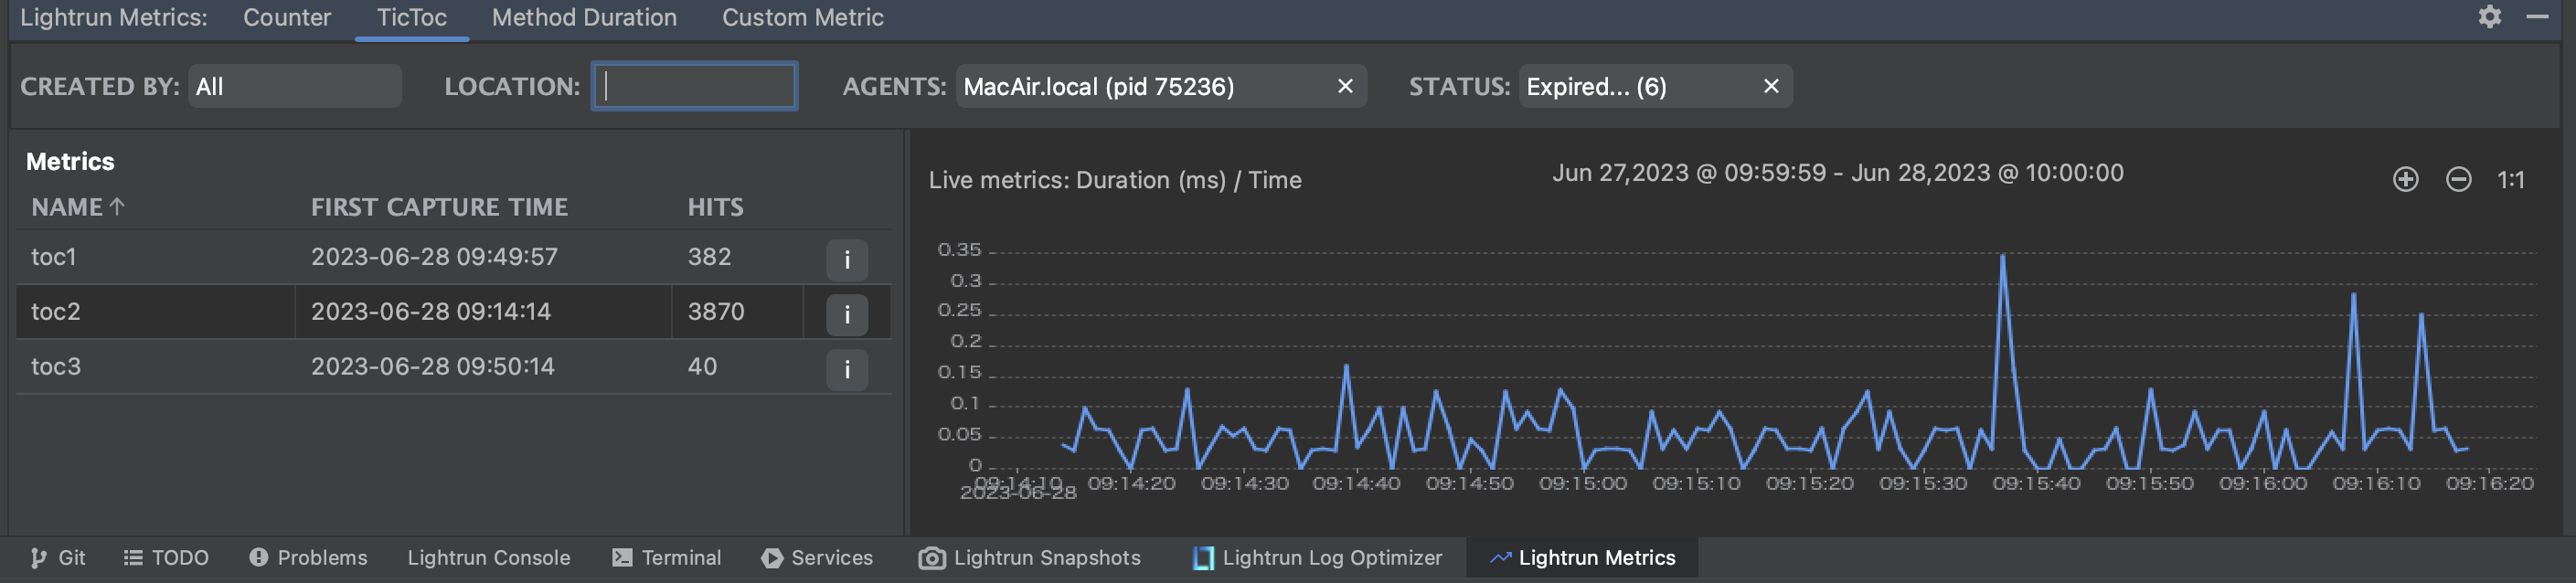
See JetBrains plugin quick tour to learn more about the Lightrun Metrics tool window.
Lightrun Console tool window🔗
Lightrun dynamic logs and metrics, by default, are printed into the application’s standard output(Stdout). This process enables them to be analyzed in the context of pre-existing logs or metrics, which might provide further clues towards solving issues.
At the same time, you can also configure your action target to Plugin. This configuration lets you view your dynamic logs and metrics output directly in your IDE through the Lightrun Console, the Lightrun Management Portal, and third-party integrated apps like Slack or Prometheus.
View logs and metrics from the JetBrains Lightrun Console🔗
Once you've configured your action target to Plugin and added at least one dynamic log or metric to your code, the Lightrun Console should display real-time output from the added dynamic log or metric.
See JetBrains plugin quick tour to learn more about the Lightrun Console tool window.
Understanding metrics data🔗
Counter🔗
An example Lightrun Counter output is shown in the code sample below:
CounterData Log{counterId='9b1e6b80-b5ec-42dd-b411-28bbb3e44059', name=counter1::*, count=751, m1_rate=49.51307448246653, m5_rate=53.94779140968095, m15_rate=54.77571845490024, mean_rate=35.71689054874403}
The following table describes the data present in a Counter output.
| Column | Description |
|---|---|
| counterId | A unique identifier assigned to the counter by the system. |
| name | The counter label. |
| count | The number of times the specified code was executed (hit count). |
| m1_rate | The average amount of counter metrics hit recorded per second for one minute. |
| m5_rate | The average amount of counter metrics hit recorded per second for five minutes. |
| m15_rate | The average amount of counter metrics hit recorded per second for fifteen minutes. |
| mean_rate | The mean rate of hits recorded per second during the entire duration of the Lightrun action. |
Time measurements🔗
An example Lightrun Time measurement output is shown in the code sample below:
TicToc Log {TicTocId='670a505f-33c1-4c8c-846b-57afaa9a236c', name='MeasurementName', count='17', max='5', min='0', mean='0.46618461992518356', stddev='1.1864864756822397'}
The following table describes the data present in a Time measurement output.
| Column | Description |
|---|---|
| TicTocId | A unique identifier assigned to the time measurement by the system. |
| name | The time measurement label. |
| count | The number of times the specified code was executed. |
| max | Maximum amount of time measured by the time measurement metric in milliseconds. |
| min | Minimum amount of time measured by the time measurement metric in milliseconds. |
| mean | Mean amount of time measured by the time measurement metric in milliseconds. |
| stddev | Standard deviation of the times recorded by the time measurement metric. |
Note
- When you create a time measurement metric, Lightrun measures the execution time of the code you’ve selected not just once but every time a thread passes through the specified code. For various reasons, like the CPU being busy with different things at a time, this often results in a slightly different execution time for each code invocation. Lightrun’s time measurement metrics data includes not just one number but enough data to understand how much time is spent in that part of your code.
- Lightrun time measurement metrics output is not displayed for each invocation; instead, the recorded time measurement data is sent to your configured output target (Plugin or Stdout) every second. This ensures that the system collecting and processing the data, typically a time series database like Prometheus, will have a constant stream of data to process. This also means you’ll see Time measurements data being produced regularly, even when the code isn’t executed.