Integrate Lightrun with StatsD🔗
Required Roles
| Up to version 1.69 inclusive | From version 1.70.4 and higher |
|---|---|
ROLE_MANAGER | Company Admin |
Statsd is a network daemon that runs on the Node.js platform and listens for statistics, such as counters and timers, that are sent over UDP or TCP protocols. It then sends aggregates of the statistics to a backend services such as Graphite.
There's a short script that performs online metric scraping from the agent log file (usually /tmp/lightrun_java_agent.INFO).
cd <install-dir>/agent/stats/
./statsd_reporter.py --host <statsd-hostname> --port <statsd-port> --logfile <agent-log-file.txt>
Prerequisites
Install and configure StatsD.
For Lightrun to send observability data to your integrations, ensure:
- The application has a running agent attached to it
- Your action Target is set to Plugin.
Connect to and disconnect from StatsD🔗
-
Open a browser and log in to your Lightrun account.
-
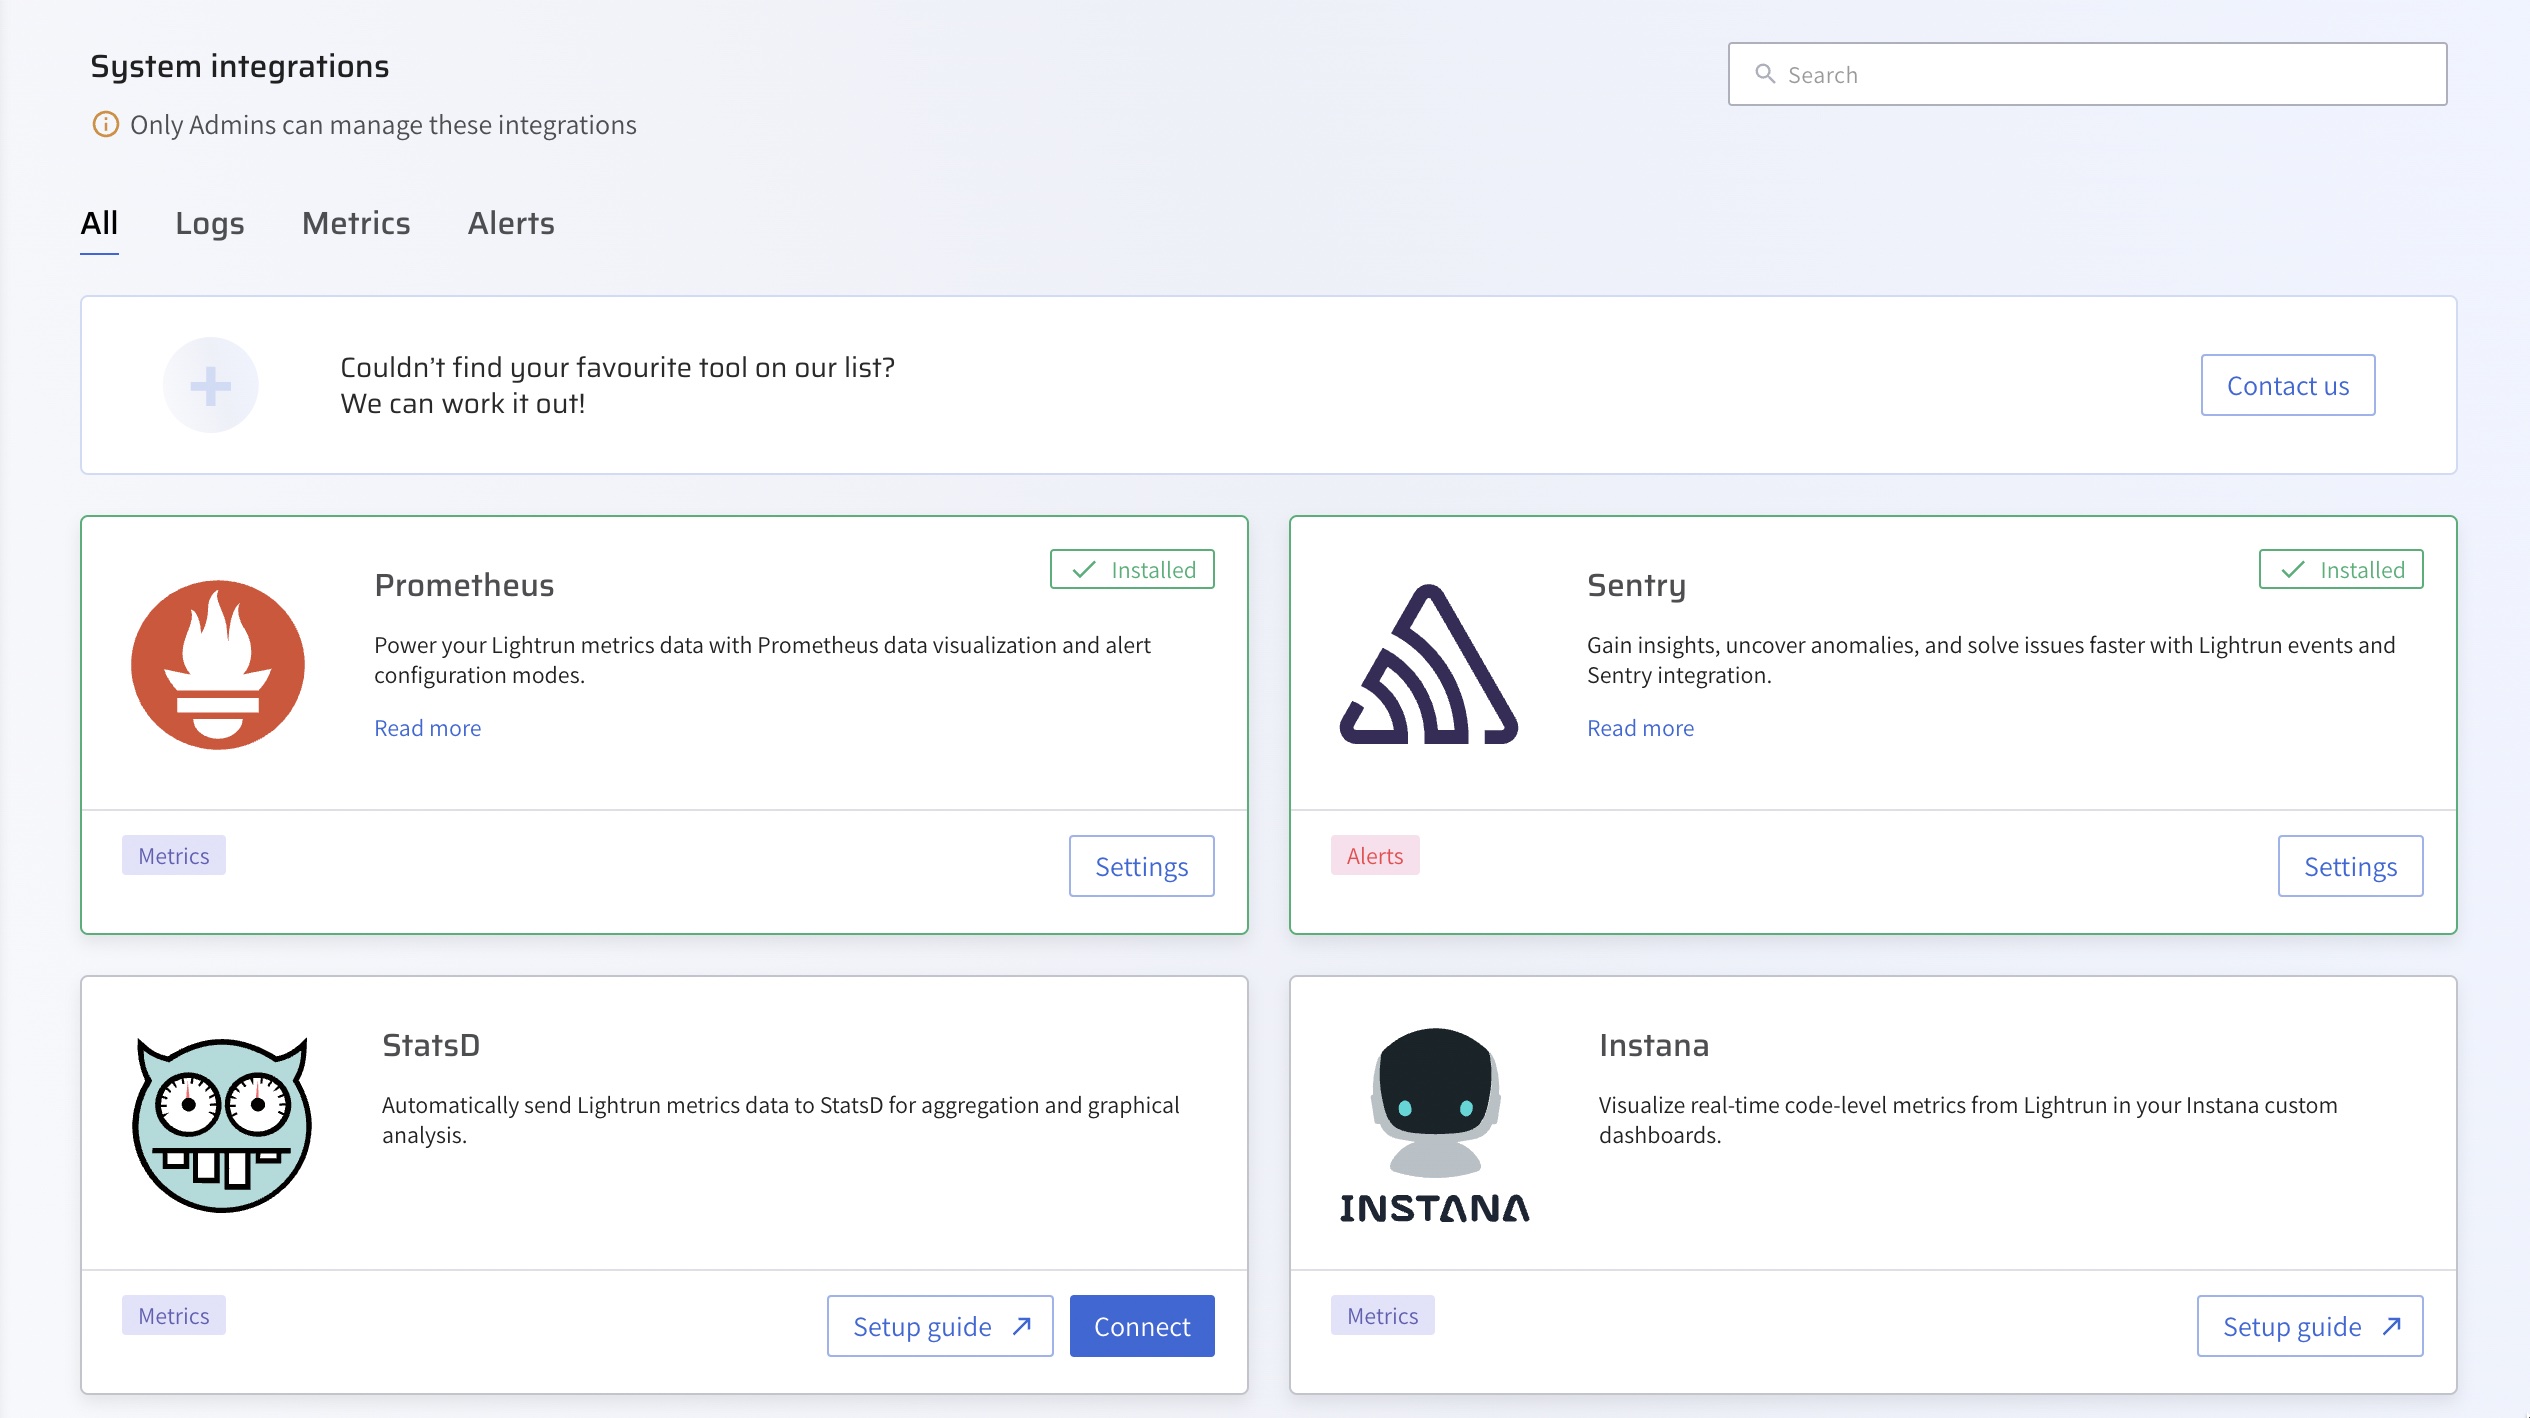
In the menu on the left, click Integrations.
The page loads with all available integrations:
-
From the Integrations page, click Connect from the StatsD card.
The Statsd Integration window pops up:
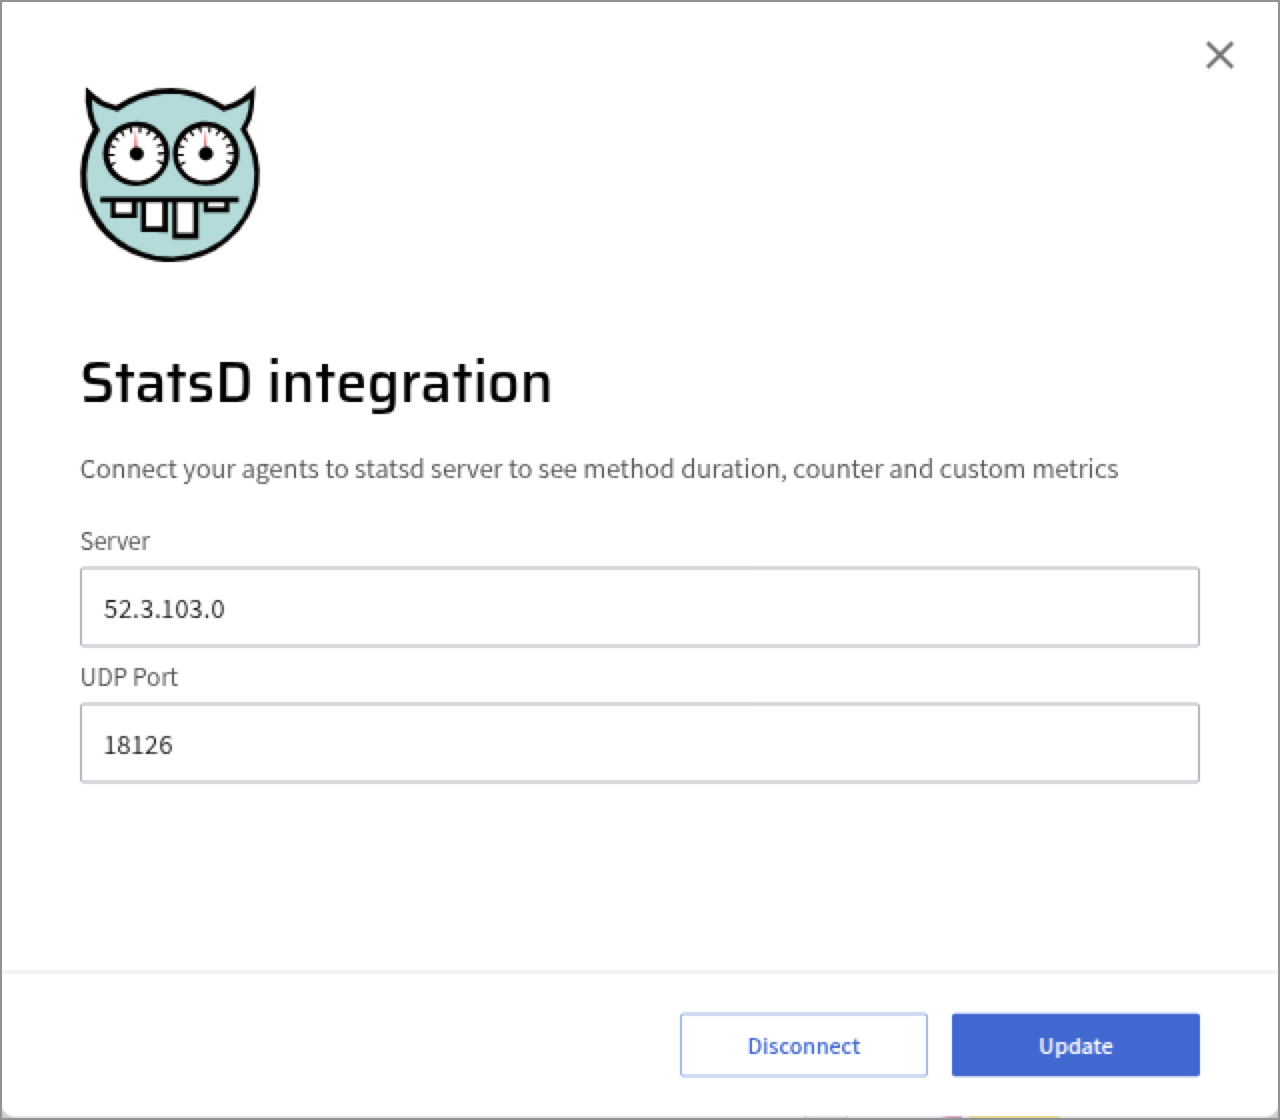
-
Complete the Server and UDP Port details, or if correct, leave the default values.
-
Click Connect and make sure you see the approval toast message.
-
To disable the configuration, click Disconnect.