Integrate Lightrun with Instana🔗
Required Roles
| Up to version 1.69 inclusive | From version 1.70.4 and higher |
|---|---|
ROLE_MANAGER | Company Admin |
When preparing to tackle challenging production bugs, it’s crucial to remember that building great infrastructure is not enough. Equally vital is the ability to gain insights into its performance. By leveraging the observability features of Lightrun and IBM Instana you will be able to observe the full stack of your production service, encompassing infrastructure, applications, and code-level information, all seamlessly integrated within Instana. Lightrun allows you to acquire, in real-time, a broad range of performance metrics for timing, synchronization, and business logic. These metrics provide immediate answers for identifying bottlenecks, with minimal impact on performance.
Lightrun supports the following metric types:
- Counter: Tracks how many times a specific line of code was reached.
- Method Duration: Checks the time it takes for a specific method to execute.
- Tic & Toc (Block Duration): Checks how much time any arbitrarily-selected block of code took to execute.
- Custom Metric: Checks what is the value of any code-level variable over time.
This guide walks you through integrating Lightrun and Instana using the Instana-Prometheus integration. This integration allows you to seamlessly transmit Lightrun metrics generated during runtime to Instana. You can then visualize these metrics in the Instana UI, allowing you to collect, emit, and visualize these Lightrun code-level metrics on an Instana dashboard from a running application within the Instana Custom Dashboard.
Before we proceed with the integration setup, let’s review the process of ingesting Lightrun metrics into Instana.
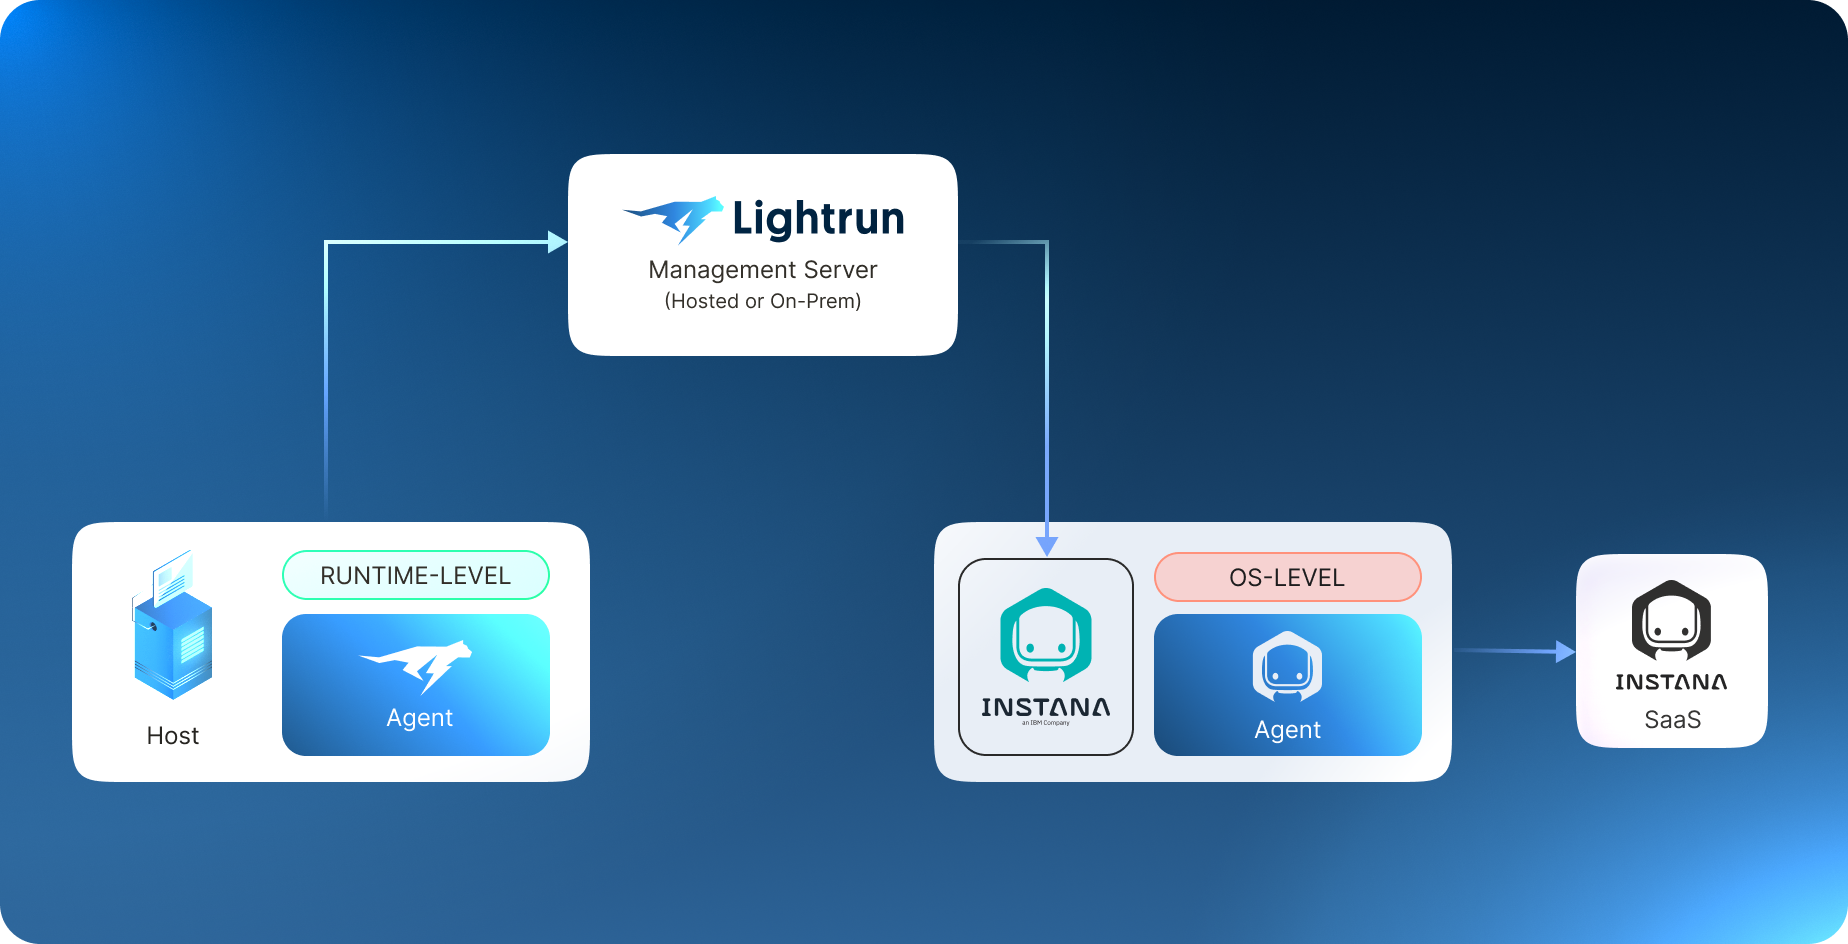
This ingestion process involves the following steps:
- Lightrun metrics are initially transmitted from the IDE Plugin to the Lightrun Management Server.
- The Instana Agent scrapes dynamic metrics from the Lightrun Management through a Prometheus endpoint
- The Instana Agent then forwards these metrics to Instana SaaS.
The workflow of setting up the Instana-Lightrun integration is described in the following sections.
Set up Instana agent with the Instana-Prometheus integration🔗
Prerequisites
- Sign up for an Instana SaaS trial here.
- Install the Instana Host Agent.
Set up Lightrun🔗
The process of working with Lightrun involves setting up a Lightrun Agent alongside your application and installing the Lightrun plugin in the IDE.
Install the Lightrun Agent🔗
The Lightrun agent is at the core of the Lightrun platform. It runs alongside your application and inserts Lightrun actions added through Lightrun IDE plugins into the application at runtime. It enables real-time instrumentation and exporting of Lightrun Actions. Lightrun's agent can coexist with Instana's agents without any issues because both types of agents rely on different capabilities of the underlying system. Instana's agent runs at the operating system level, typically as a separate binary or container, while Lightrun's agent runs at the runtime level (JVM, V8, etc.) and is usually delivered as a runtime agent or language-level package. To install the Lightrun agent, see Lightrun Agents.
Install the Lightrun Plugin🔗
Lightrun's IDE Plugin enables the addition of real-time, code-level information to your running production applications. To install the plugin, refer to Lightrun Plugins.
Set up the Lightrun-Prometheus integration🔗
Prometheus scrapes and stores Lightrun metrics locally which is set as a configured target and then runs rules over the data for aggregation, recording, and alerting.
To set up the Lightrun-Prometheus integration, refer to Integrate Lightrun with Prometheus.
Insert Lightrun metrics into your code🔗
Access your Lightrun IDE plugin and set up the metrics to be piped to Instana by setting the Target to Prometheus. The following example displays how to add a counter metric to the aws source that is added to a single line of code. A counter metric counts the number of code lines the code line has reached.
INSERT A COUNTER METRIC INTO YOUR CODE🔗
- Place your cursor at the line in your source code where you want to insert the Counter, and right-click to open the context menu.
-
Hover over Lightrun and, from the Metrics menu, select Counter.
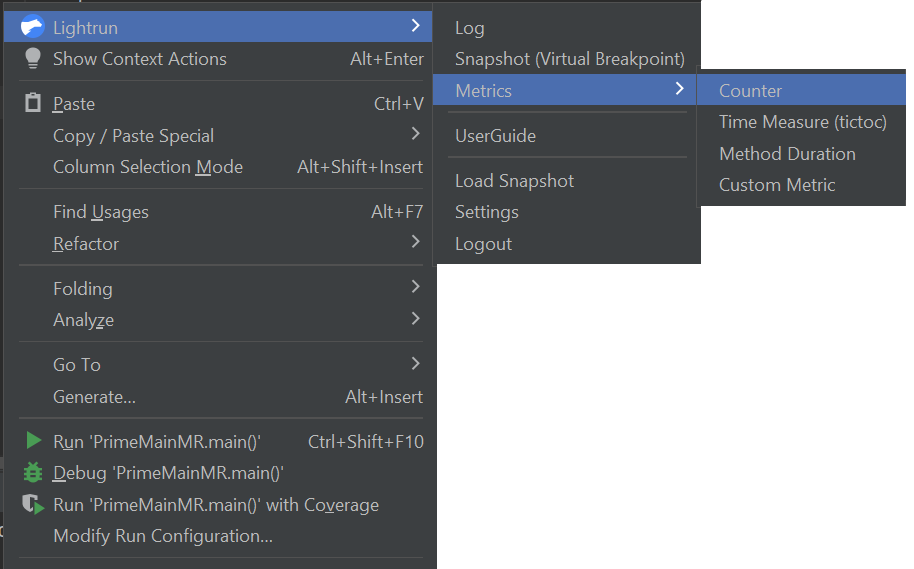
The Insert a Counter page opens.
-
In the Target field, select Prometheus as your preferred action output target.
-
Click OK to add the Counter metric to your code. The
 icon should appear in the left gutter of the editor next to the code line where the action was added.
Set up Instana Agent with Prometheus🔗
- Sign up for an Instana SaaS trial here.
- Install the Instana Host Agent.
Configure your Instana host agent with Prometheus plugin details🔗
After you install the Instana host agent, the Instana Prometheus sensor is automatically installed, but you need to configure the sensor as outlined in the Configuring section. Then, you can view metrics that are related to Prometheus in the Instana UI.
- Install the Instana Host Agent on any machine that has at least one incoming open port. It is recommended to use the port already utilized for communication with the Lightrun Management Server.
- Update the
<agent_install_dir>/etc/instana/configuration.yamlfile with the required parameters to collect Prometheus metrics from the Lightrun Server. For more information, see the official IBM documentation regarding setting up the YAML to collect Prometheus metrics.
An example of how to set up the YAML to collect Prometheus metrics from the Lightrun Server follows:
com.instana.plugin.prometheus:
  poll_rate: 15                              # Global polling interval in seconds (optional, default is 1 second)
  username: ''                               # Global (all) endpoints username/password configuration (optional)
  password: ''
  podConnectTimeout: 750                     # discovery TCP connect timeout in ms used during discovery request (optional, default is 750ms)
  podReadTimeout: 2500                       # discovery TCP read timeout in ms used during discovery request (optional, default is 2500ms)
  customMetricSources:
  - url: 'https://app.lightrun.com/athena/company/33a42011-098c-43ae-9df7-3b9481e778b8/integrations/prometheus/metrics'
    metricNameIncludeRegex: '^.'             # regular expression to filter metrics
    username: ''                             # Lightrun-specific username/password configuration (if needed)
    password: ''
    headers:
      Authorization: 'Bearer LIGHTRUN_API_KEY'  # Replace with your actual API key
    tlsConfig:
      insecureSkipVerify: false
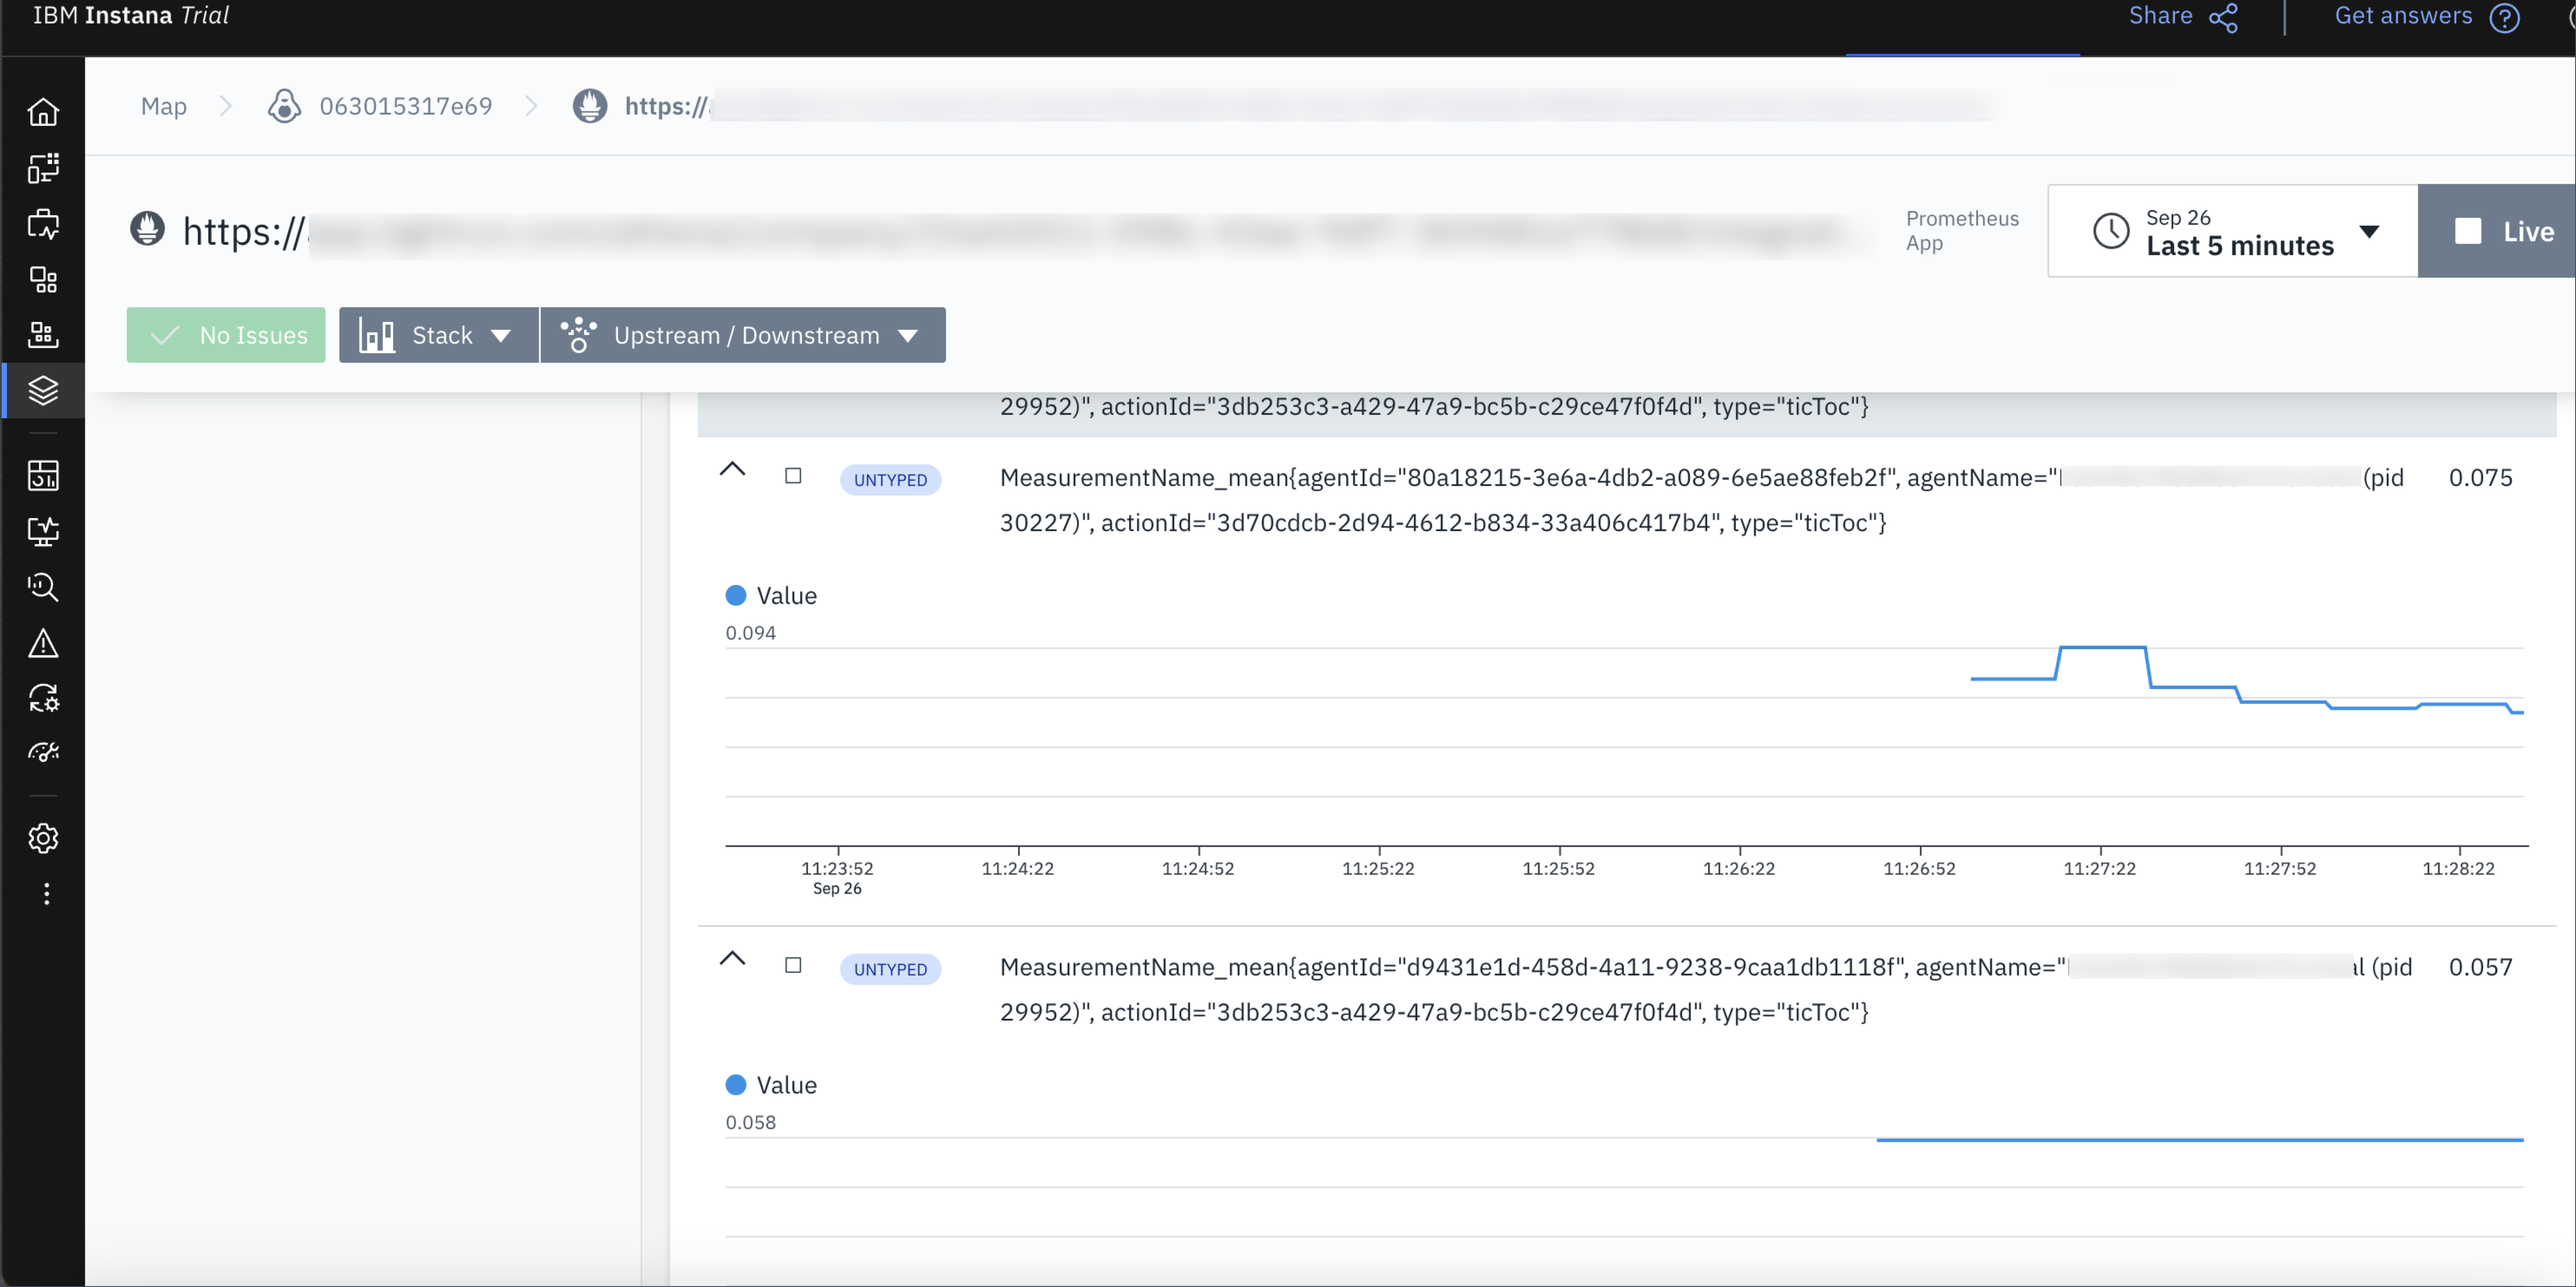
View the metrics in the Instana UI🔗
Access the Instana UI and view the metrics under the Prometheus integration in Instana dashboard.
- In the sidebar of the Instana UI, select Infrastructure.
-
Click the Lightrun monitored host.
Further reading🔗
To learn more about the IBM Instana and Lightrun Dynamic Observability Platform, see IBM Instana and Lightrun Observability Platform Solution Brief.