Integrate Lightrun metrics into Grafana using the Grafana agent🔗
In this guide, you will learn how to scrap metrics data from Lightrun and push the metrics data to a Grafana cloud-hosted Prometheus instance for visualization with Grafana.
Grafana is an open-source analytics and monitoring solution for databases. By integrating Grafana with Lightrun, we can collect real-time metrics data (counter, tic toc, custom metrics) from our live applications with Lightrun and send them directly to Grafana for monitoring and visualization from our preferred IDE without pushing new code.
Prerequisites🔗
This tutorial assumes that you have:
- A Lightrun account.
- A Grafana Labs account. Register for a Grafana free account here.
Enable Lightrun Prometheus integration🔗
The first step in the tutorial will be to activate the Lightrun Prometheus integration.
To do that:
-
Open a browser and log in to your Lightrun account.
-
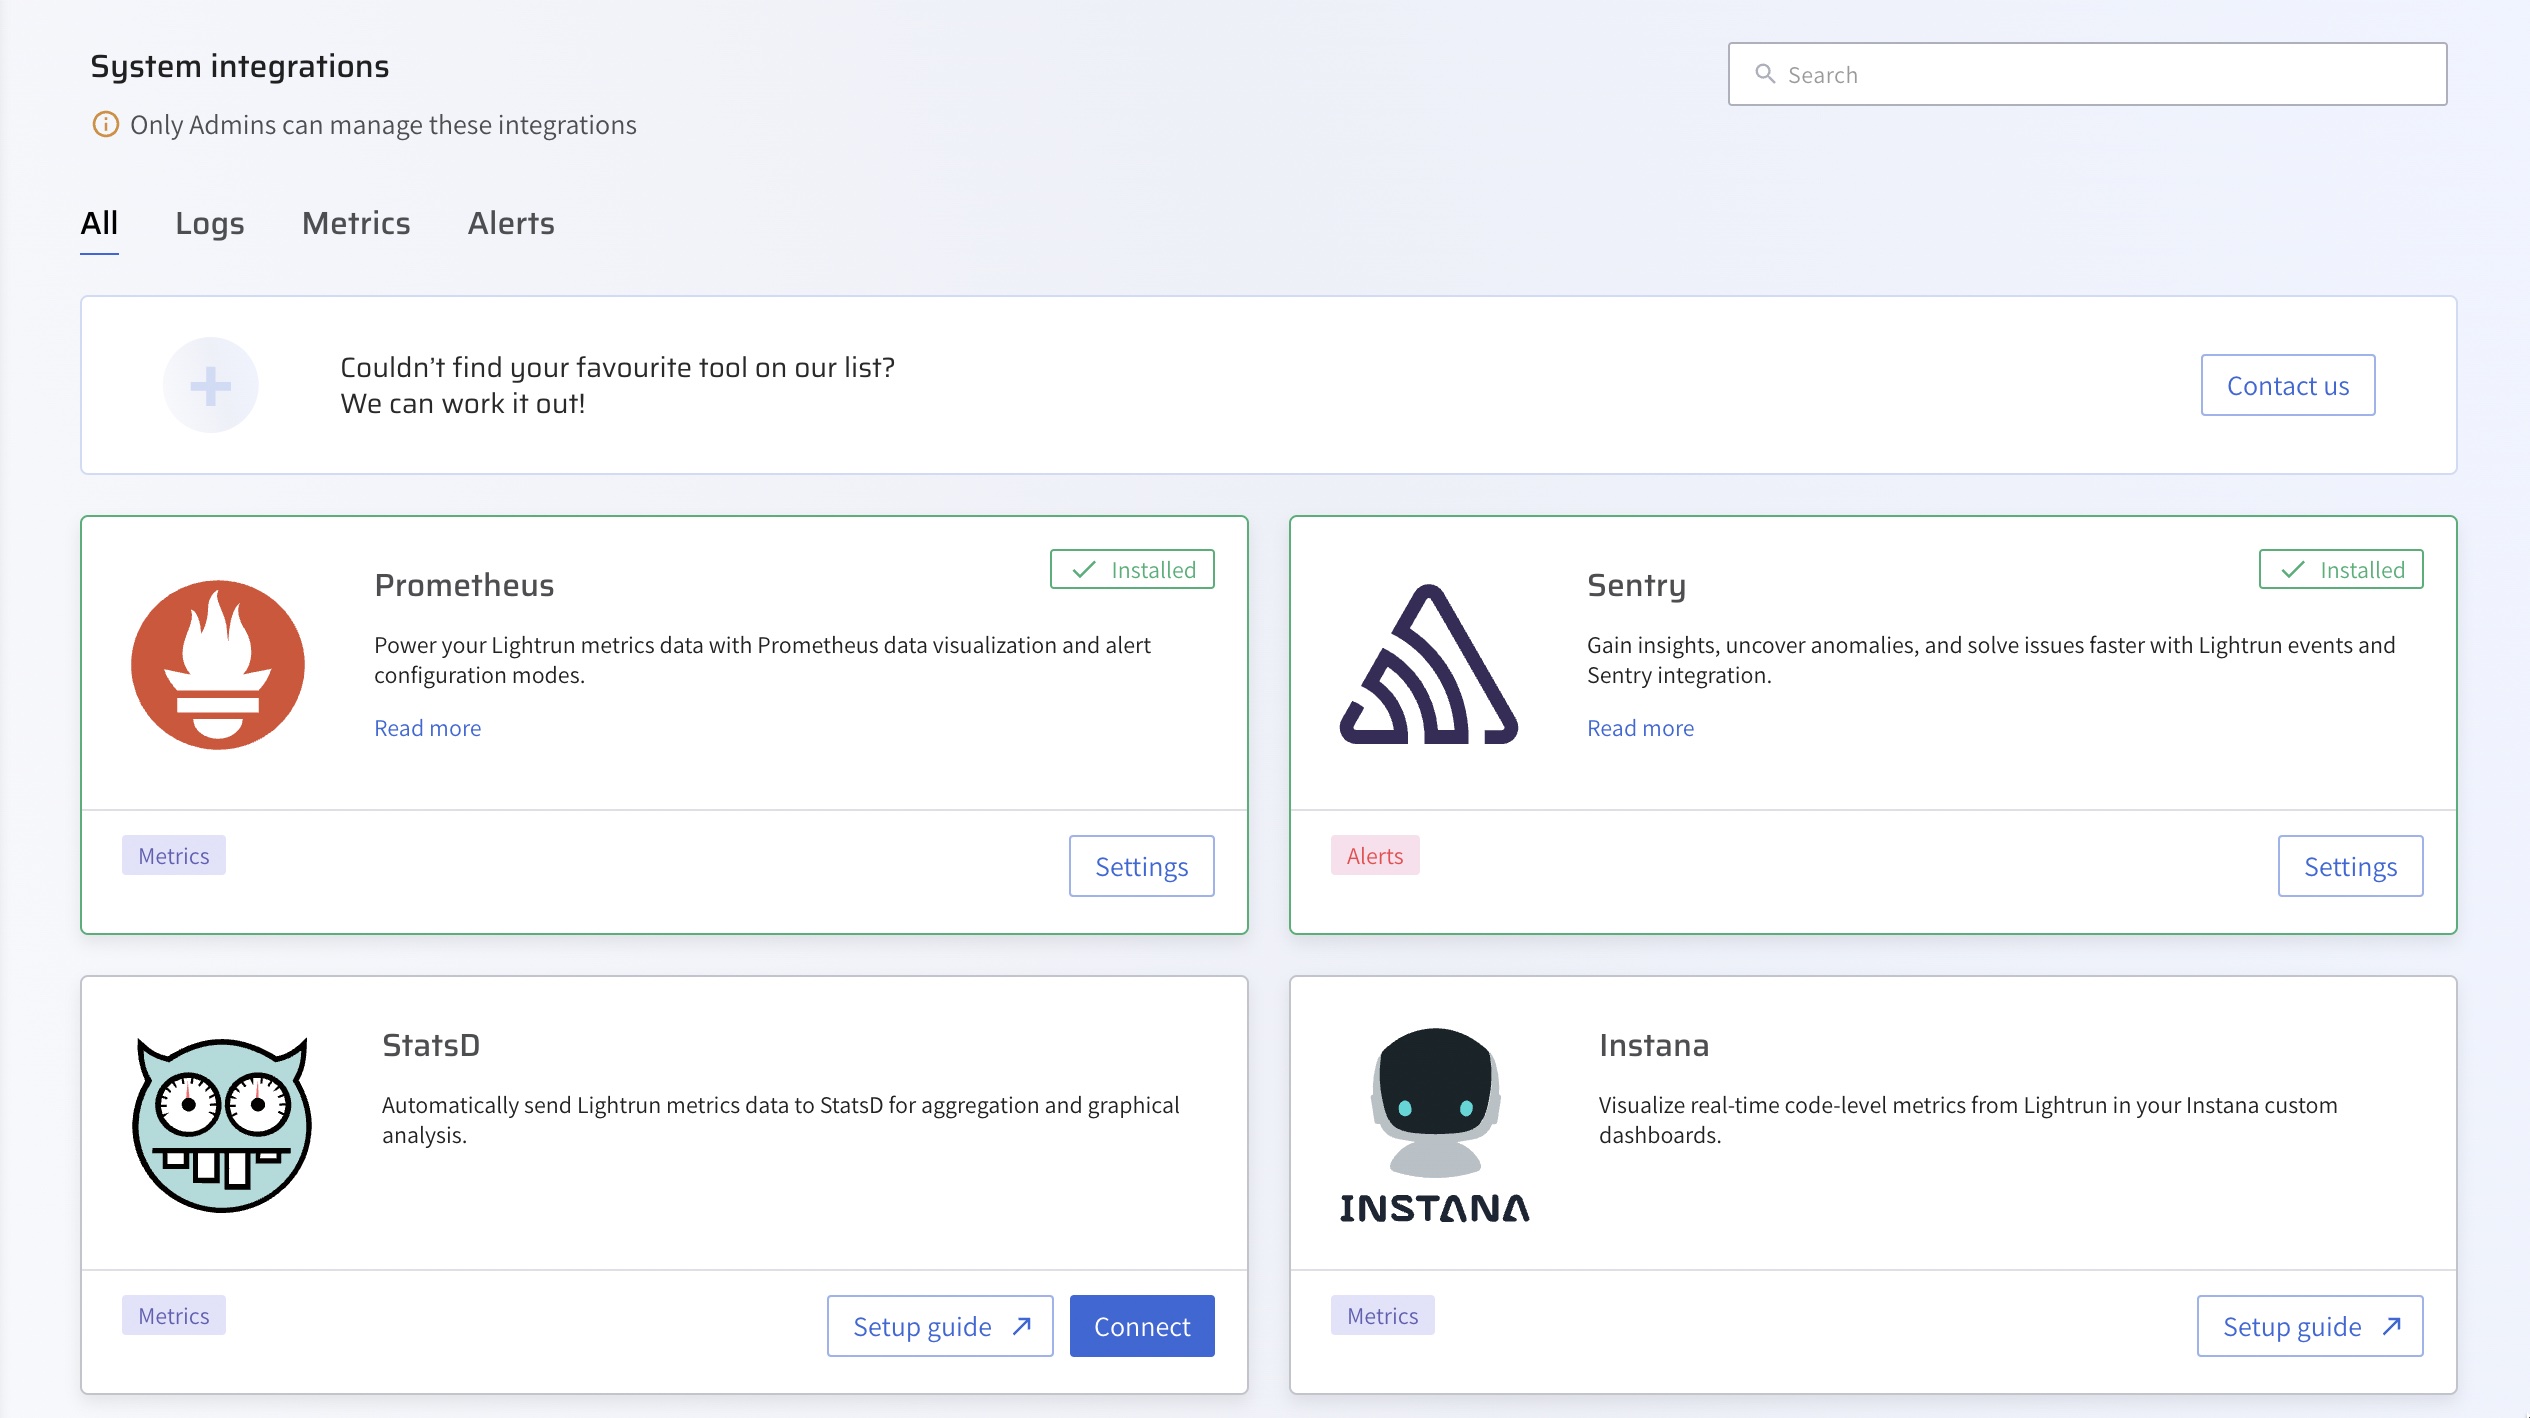
In the menu on the left, click Integrations.
The page loads with all available integrations:
-
From the Integrations page, click Connect from the Prometheus card.
The Prometheus Integration window pops up:
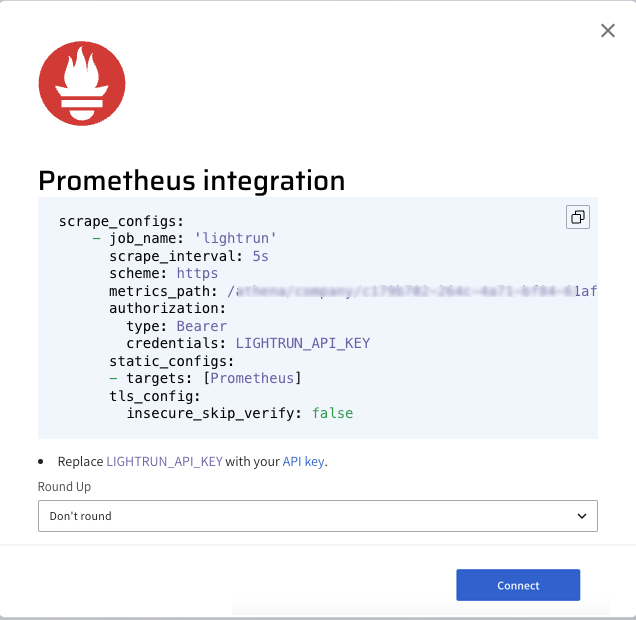
-
From the Round Up dropdown list, select the rounding rule to be applied by Prometheus for your Lightrun data.
- Click Copy from under the scrape configuration.
- Click Connect and wait for the approval toast message.
Configure the Grafana agent🔗
The next step in this tutorial is to configure the Grafana agent. The Grafana agent is a batteries-included telemetry collector that can be used to collect logs, metrics, and traces for Grafana.
Note
The Grafana agent works with the same metrics format as Prometheus, hence can connect easily to Lightrun using the same scrape config file as Prometheus.
To install and run the Grafana agent,
- Log in to your Grafana account and click Create a dashboard.
- Click Create your own and select Prometheus on the Choose a data connection page.
- Select Send Prometheus Metrics to Grafana Cloud.
- In the Configuration Details page, select Via Grafana Agent as your method for forwarding metrics. Choose your relevant OS architecture, then download and configure the required agent binaries.
- Enter your API token name and click Create API to create your API token.
- Copy and run the displayed code to generate your Grafana
agent-config.yamlfile. - Enter your copied Lightrun scrape configuration into the
agent-config.yamlfile. - Run your Grafana agent as specified in the instructions.
Important
Your agent-config.yaml file should appear similar to the following.
metrics:
    global:
        scrape_interval: 5s
        remote_write:
            - url: https://prometheus-prod-13-prod-us-east-0.grafana.net/api/prom/push
        basic_auth:
            username: <grafana-cloud-username>
            password: <grafana-cloud-password>
    configs:
        - name: hosted-prometheus
          scrape_configs:
            - job_name: "lightrun"
                scrape_interval: 5s
                scheme: https
                metrics_path: /athena/company/<lightrun-company-key>/integrations/prometheus/metrics
                static_configs:
                    - targets: [app.lightrun.com]
                tls_config:
                    insecure_skip_verify: false
            remote_write:
                - url: https://prometheus-prod-13-prod-us-east-0.grafana.net/api/prom/push
                    basic_auth:
                    username: <grafana-cloud-username>
                    password: <grafana-cloud-password>
Confirm your integration🔗
To confirm your integration, insert a Lightrun metric into your application and select Prometheus as your target. Then log in to your Grafana dashboard and navigate to Explore to visualize the collected data.
Troubleshooting🔗
-
msg="Scrape failed" err="Get \"https://app.lightrun.com:443/athena/company/<company_id>/integrations/prometheus/metrics\": context deadline exceeded"- This error occurs when your Grafana agent timed out before sending the collected metrics data to Grafana cloud. To resolve.- Increase the
scrape_timeoutperiod in youragent-config.yamlfile. - Ensure that your firewall rules are not blocking Grafana agent queries to the Lightrun server.
- Ensure that there are no communication issues with your Grafana agent server.
- Increase the