Scrape Lightrun dynamic logs using Datadog🔗
Required Roles
| Up to version 1.69 inclusive | From version 1.70.4 and higher |
|---|---|
ROLE_MANAGER | Company Admin |
You can use Datadog to scrape the Lightrun log file and send the log data directly to you Datadog account.
Prerequisites
- A Datadog account with API key access
- A Datadog Agent installed and configured with the aforementioned Datadog account
Configure the Lightrun agent to output logs in JSON format - JVM🔗
By default, the Lightrun logs are written in XML format. The Datadog agent does not know how to parse XML logs without pre-processing, but it does know how to parse JSON Logs automatically.
You can configure the aggent to output logs in JSON format in the Lightrun agent's config file, located in <PATH_TO_AGENT>/agent.config:
com.lightrun.DynamicLog.FileHandler.formatter=json
Note
You can make sure the output is set to JSON by tailing the log files (make sure your Lightrun agent is currently printing logs):
tail -f /tmp/lightrun_file_handler_logs*.log
Configure the Lightrun agent to output logs in JSON format - Node.js & Python🔗
The Lightrun Node.js & python agents write logs out to the console/stdout by default.
There are 2 approaches you can take in order to make sure the datadog agent collects these logs:
- Pipe the program's output directly to a file, and add it as a file source in
conf.yamlbelow. This can be done on unix-like systems bynode app.js >> /tmp/lightrun_nodejs_logs.logorpython app.py >> /tmp/lightrun_python_logs.logrespectively. - You can use an application-level logger to write logs to a file - i.e. by using
winstonin a node application or the common logging facility for Python.
Configure Datadog to scrape the log files🔗
First you need to enable log collection in /etc/datadog-agent/datadog.yaml by uncommenting the following property:
logs_enabled: true
Now you need to configure the Datadog agent to scrape the Lightrun log file. Create the configuration folder:
mkdir /etc/datadog-agent/conf.d/lightrun.d/
/etc/datadog-agent/conf.d/lightrun.d/conf.yaml: Hint
You can change the name conf.yaml to a more indicative name
logs:
  - type: file
    path: "/tmp/lightrun_file_handler_logs*.log"
    service: "<YOUR_APPLICATION/SERVICE_NAME>"
    source: "Lightrun"
Restart your Datadog service
sudo service datadog-agent restart
View Lightrun logs in your Datadog account🔗
- Login to your Datadog account
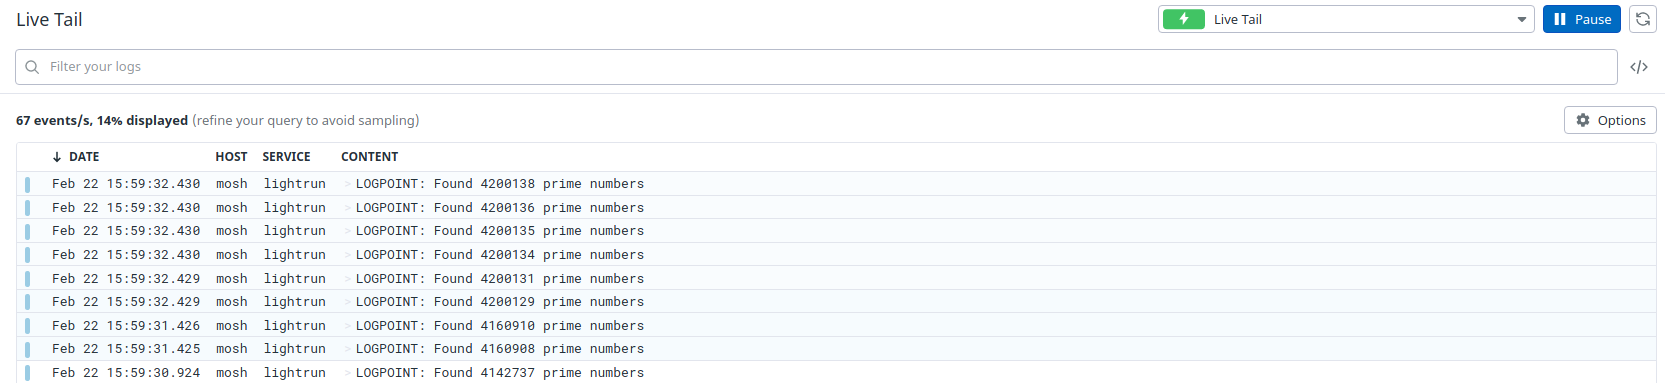
- Go to Live Tail
Your logs should now appear in Datadog's live tail console
Troubleshooting🔗
- Make sure the Lightrun logs are continuously printed to the log files and are in JSON format
tail -f /tmp/lightrun_file_handler_logs*.log - Make sure Datadog agent is running
service datadog-agent status - Make sure Datadog agent successfully found the log file Example output
datadog-agent status========== Logs Agent ========== Sending compressed logs in HTTPS to agent-http-intake.logs.datadoghq.com on port 443 BytesSent: 2.5242779e+07 EncodedBytesSent: 738819 LogsProcessed: 66557 LogsSent: 66493 lightrun -------- - Type: file Path: /tmp/lightrun_file_handler_logs*.log Status: OK 2 files tailed out of 2 files matching Inputs: /tmp/lightrun_file_handler_logs1.log /tmp/lightrun_file_handler_logs0.log BytesRead: 1.1758002e+07 Average Latency (ms): 49 24h Average Latency (ms): 49 Peak Latency (ms): 1256 24h Peak Latency (ms): 1256 - Make sure Datadog's API key is configured and that the API key is valid Example output
cat /etc/datadog-agent/datadog.yaml | grep api_key:$ cat /etc/datadog-agent/datadog.yaml | grep api_key: api_key: ****************************ac11